When Covid-19 hit the United States in 2020, the Federal Reserve responded with a vigorous asset-purchase program. The Fed’s purchases placed new money in the hands of those who had sold securities to the Fed. This resulted in the fastest sustained rate of money supply (M2) expansion in peacetime since the founding of the Fed in 1913, with M2 growth peaking at 26.9 percent per year in February 2021.
At the same time that the Fed was pumping money into the economy, U.S. authorities were shutting the economy down. As a result of the lockdowns, supply chains were severely disrupted, and the demand for a variety of goods and services—especially services—fell sharply.
With these changes, prices briefly fell, and it took some months for economic activity to pick up again. But when it did, the pace of the expansion was very strong, fueled by the huge increase in the money supply and purchasing power that had been injected into the economy between March and May 2020. Prices, however, took longer to respond—as they typically do. By spring and early summer 2021, the injection of economic fuel delivered by the money surge started to affect prices, with the Consumer Price Index (CPI) jumping from 1.7 percent per year in February 2021 to 5.3 percent by June.
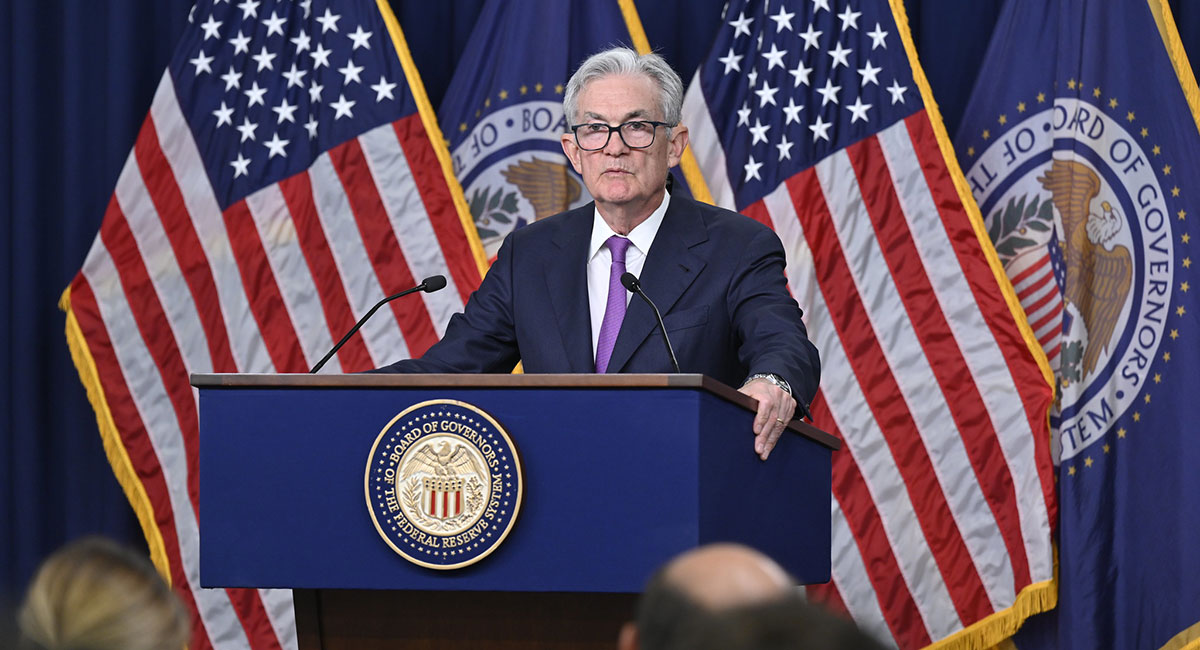
Because the economy was still being affected by lockdowns and demand remained distorted away from services and towards consuming goods, most economists, including those at the Fed, attempted to explain the inflation by arguing that it was “transitory,” meaning a product of distortions in overall demand and the continuing disruptions to supply chains. Once the distortions were resolved, prices would supposedly return to their pre-pandemic levels. That conjecture and the word “transitory” continued to be popular until Jay Powell, the Fed chairman, acknowledged during a congressional hearing on November 30, 2021, that he expected high inflation to persist until mid-2022. With that, the narrative of “team transitory” was amended to reflect the fact that the word “transitory” carried with it an unspecified timeframe, and that the inflation would simply last longer than it had originally asserted.
So much for the explanation by “team transitory” for the surge in U.S. inflation. What about the disinflation, which started in July 2022? “Team transitory” continues to embrace the canard that the course of the price level is determined by non-monetary factors. It asserts that the decline in CPI has been the result of the repair in supply chains, declines in oil prices, a collapse in base-metal prices, and a plethora of changes in other non-monetary factors. These are repeatedly trotted out by those responsible for covering the Fed in mainstream newspapers. Just look at practically anything written by Nick Timiraos in the Wall Street Journal, Jeanna Smialek in the New York Times, and Colby Smith in the Financial Times. Rest assured that these reporters avoid mentioning that changes in inflation rates have been caused by changes in the supply of the economy’s fuel: money.
Leaving aside such omissions, what does the quantity theory of money have to say about inflation? Based on the authority of Milton Friedman, who famously said that “inflation is always and everywhere a monetary phenomenon,” or the distinguished Harvard professor, the late Gottfried von Haberler, who wrote in his influential 1985 monograph The Problem of Stagflation hat “there has never been a significant inflation or stagflation—prices rising, say, by 4 percent or more a year for two or more years—without a significant growth in the stock of money,”we can say that significant ups and downs in the CPI are generated by the ups and downs in the money supply.
Sure enough, given the magnitude of the excess money growth in 2020–21 and the quantity theory of money, it was possible to calculate quite accurately—as we did—the price increases that were likely to result from the Fed’s excesses. Indeed, we predicted that the CPI would increase to as much as 9 percent, which turned out to be very close to the 9.1 percent CPI peak recorded in June 2022.
Just where did all the Fed’s money go and how did it, with a lag, end up as inflation? Well, M2 increased by 35 percent between March 2020 and March 2023. Roughly 10 percentage points fueled real economic growth (2020-2023), roughly 9 percentage points were absorbed by increased money holdings, and the remainder, about 16 percentage points, ended up fueling inflation.
So much for the upswings in the money supply and inflation. What about their downswings? The money supply and inflation picture has changed dramatically over the past eighteen months. Instead of running its printing presses at an excessive rate as it did in 2020–21, the Fed, since April 2022, has been presiding over an almost unprecedented decline in the quantity of money, with M2 contracting by 4.5 percent since March 2022—something not seen since the 1929–33 period. The primary cause of this decline is the Fed’s rapid disposal of its holdings of securities, sometimes called quantitative tightening. As night follows day, inflation, with a lag, has been falling rapidly. It’s now running at 3.1 percent per year, and we think it will probably end this year below the Fed’s inflation target of 2 percent.
With its repeated assertions and inflation canards, “team transitory” has failed to correctly forecast the cause of inflation and has misled the public. Before the Fed precipitates another roller-coaster ride, it must realize that monetary policy is not about interest rates, but about the rate of growth in the money supply. And just what should that rate be? Well, a rate that would allow the Fed to hit its inflation target of 2 percent per year. The quantity theory of money, coupled with the relevant U.S. metrics, says that an M2 growth rate of around 6 percent per year should do the trick.