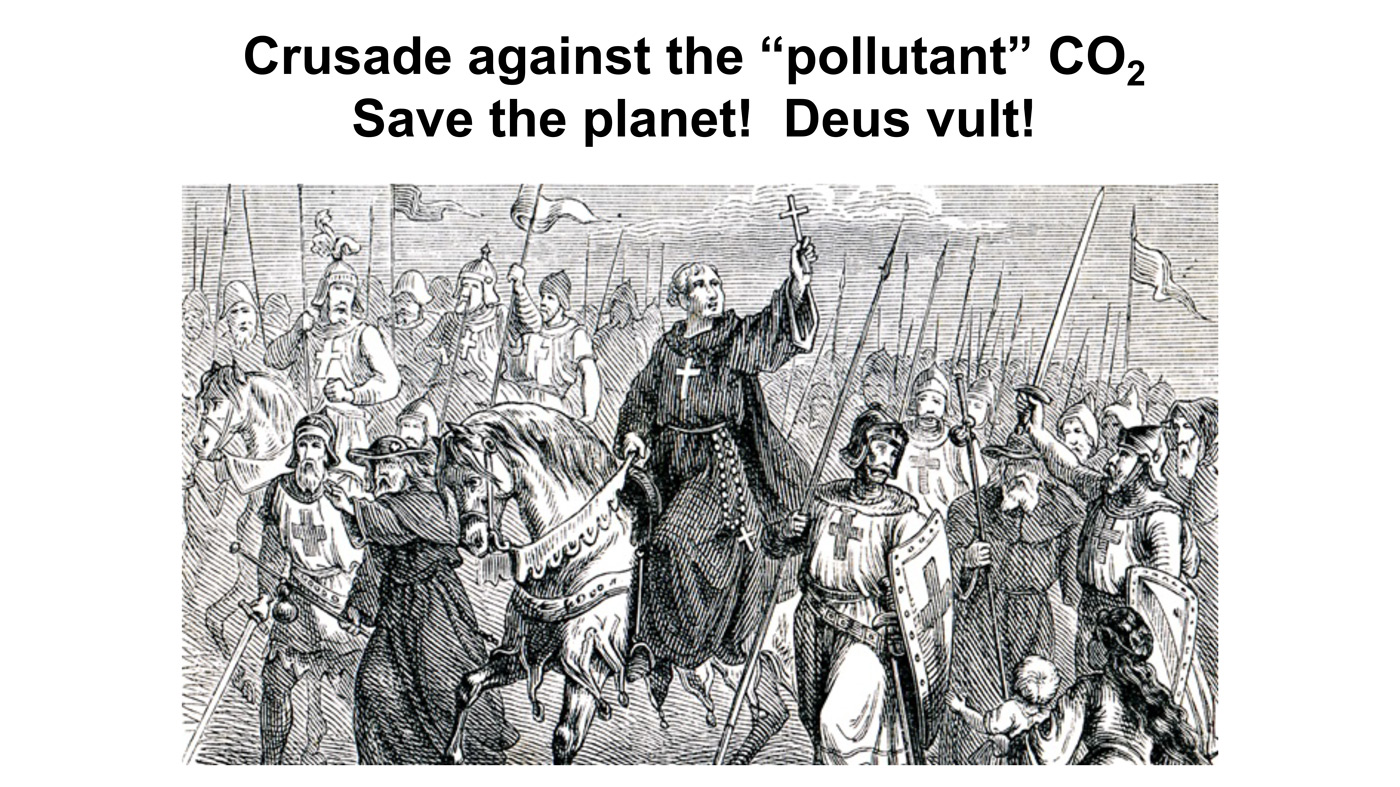
The best way to think about the frenzy over climate is to consider it a modern version of the medieval Crusades. You may remember that the motto of the crusaders was “Deus vult!”, “God wills it!” It is hard to pick a better virtue-signaling slogan than that. Most climate enthusiasts have not gone so far, but some actually claim that they are doing God’s work. After decades of propaganda, many Americans, perhaps including some of you here today, think there really is a climate emergency. Those who think that way, in many cases, mean very well. But they have been misled. As a scientist who actually knows a lot about climate (and I set up many of our climate research centers when I was at the Department of Energy in the early 1990s) I can assure you that there is no climate emergency. There will not be a climate emergency. Crusades have always ended badly. They have brought discredit to the supposed righteous cause. They have brought hardship and death to multitudes. Policies to address this phony climate emergency will cause great damage to American citizens and to their environment.
Climate frenzy is really heating up recently. On February 4th Senator Bernie Sanders, Congresswoman Alexandra Ocasio-Cortez, and Congressman Earl Blumenauer introduced “legislation mandating the declaration of a national climate emergency. The National Climate Emergency Act directs the President of the United States to declare a national climate emergency and mobilize every resource at the country’s disposal to halt, reverse, mitigate and prepare for the consequences of this climate crisis.” (This is from Mr. Blumenauer’s website.) But this is utter nonsense. There is no climate crisis, and there will not be a climate crisis
It gets worse when you get to the state levels where there are fewer checks and balances. These are the remarks made last week by Charles Ismay, the Undersecretary for Climate Change in Massachusetts to the Vermont Climate Council:
So let me say that again, 60% of our emissions that need to be reduced come from you, the person across the street, the senior on fixed income, right . . . there’s no bad guy left, at least in Massachusetts to point the finger at, to turn the screws on, and you know, to break their wills, so they stop emitting. That’s you. We have to break your will. Right, I can’t even say that publicly.
A few days later Mr. Ismay resigned and had he not, his governor would have fired him. But, that’s the way crusades are. This is really not a question of science. This is a question of a secular religion for some. It is a question of money for others. It is a question of power for others. But whatever it is, it is not science.
Part of the medieval crusades was against the supposed threat to the holy sites in Jerusalem. But a lot of it was against local enemies. The medieval Inquisition really did a job on the poor Cathars, on the Waldensians of southern France, and on the Bogomils in the Balkans. Climate fanatics don’t know or care any more about the science of climate than those medieval Inquisitors knew or cared about the teachings of Christ.
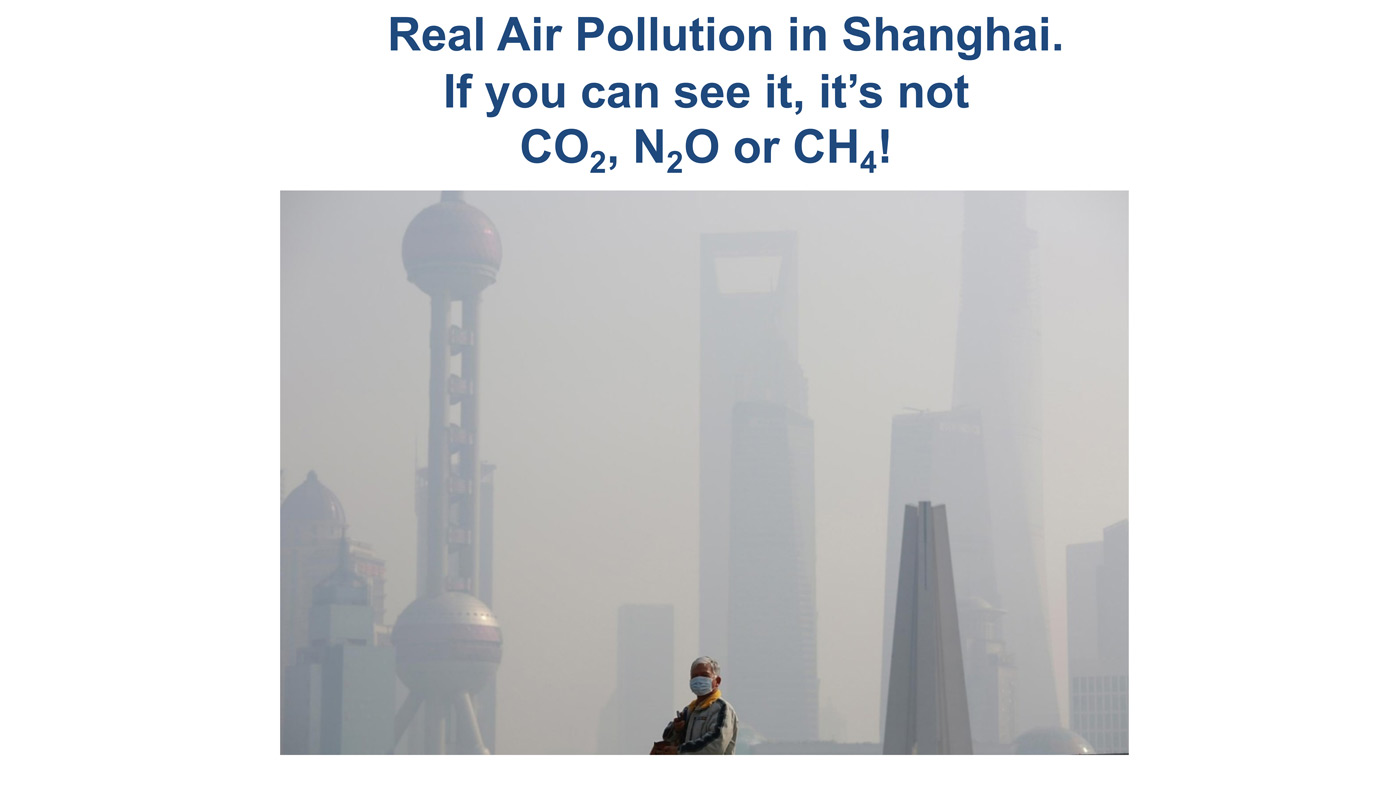
Just about everyone wants to live in a clean environment. I do, and I am sure everyone here does. This is a photograph of Shanghai, and that’s real air pollution. You can just barely see the Bottle Opener Building in the back through all the haze. Some of this is due to burning coal. But a bigger fraction is due to dust from the Gobi Desert. They have had this type of pollution in Shanghai since the days of Marco Polo and long before. Part of it is burning stubble of the rice fields, which is traditionally done before planting next year’s crop. This is real pollution. I would not want to live in a city like that. If there is anything to do that would make it better, I would certainly support that.
But, none of this has anything to do with CO2. CO2 is a gas you cannot see, smell or taste. So, hare-brained schemes to limit emissions of CO2, which is actually beneficial, as I will explain a little bit later, will only make it harder to get rid of real pollutants like what I just showed you in Shanghai.
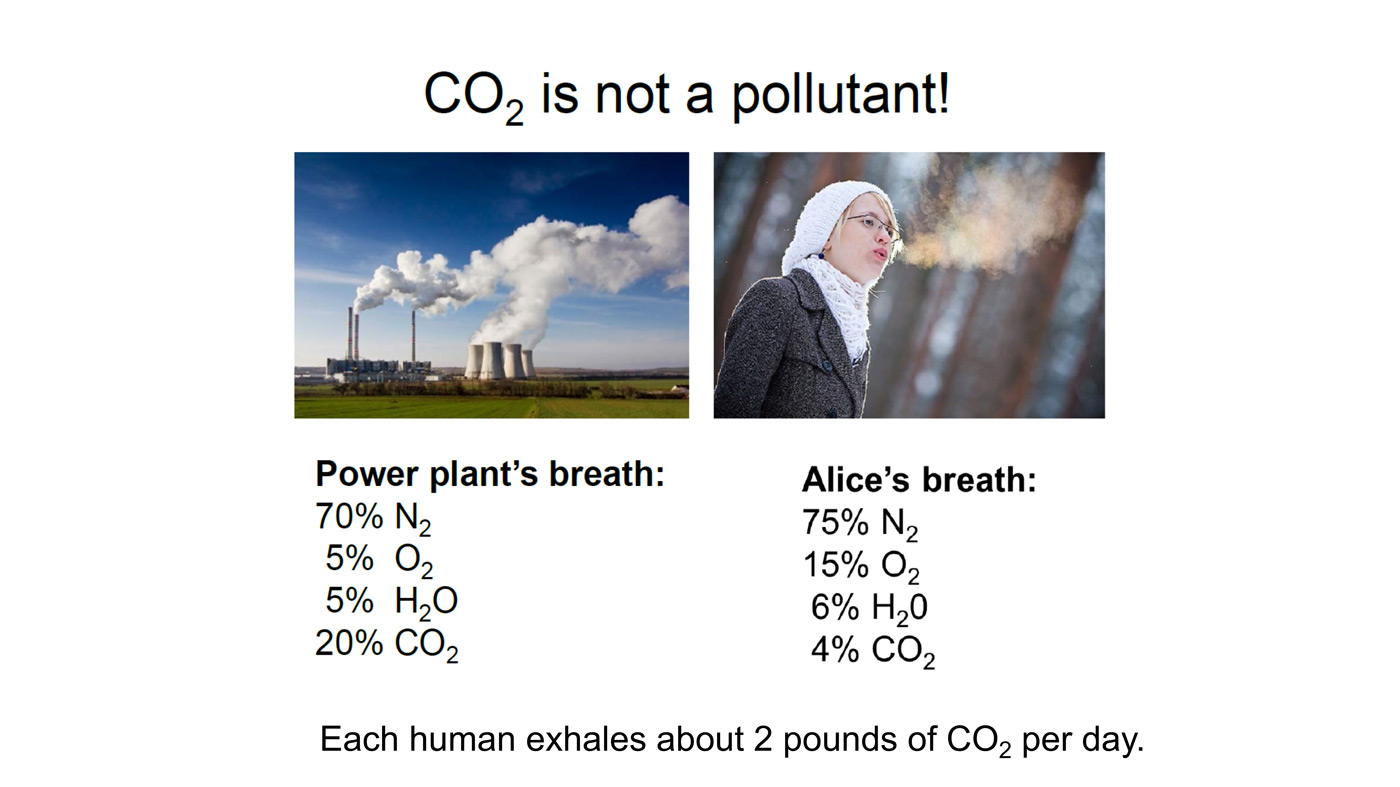
So, let’s talk about CO2. Number one, it is not a pollutant at all. We breathe out lots of CO2. Many people are surprised to learn that they exhale a little more than two pounds of CO2 a day. You people in this room are putting out a lot of CO2. I actually brought a CO2 meter here which I am going to turn on. It takes about 30 seconds to warm up, but we will see what the levels are. Before I came down here, my wife Barbara and I measured the CO2 on our balcony, and it is about 400 parts per million outside this building. The meter is warming up now. I will show what the results are in a minute. But our breath is not that different from the output of a power plant. Power plants take in normal air, and they consume most of the oxygen by burning coal, or natural gas, or oil. The exhaust that comes out of the stack is mostly the nitrogen that was already there—a little bit of oxygen that was not used up, along with water vapor and CO2. Our breath is similar, except it has a lot more oxygen. So, you can give mouth-to-mouth resuscitation, but you couldn’t if your breath was like the power plant exhaust. Your breath contains about four percent CO2, six percent water. The power plant has a bit more CO2 and correspondingly less oxygen. But our breath is definitely not a pollutant. In fact, our breathing reflex is determined by CO2. It is not determined by oxygen. It is not a lack of oxygen; it is too much CO2 that makes you take another breath of air.
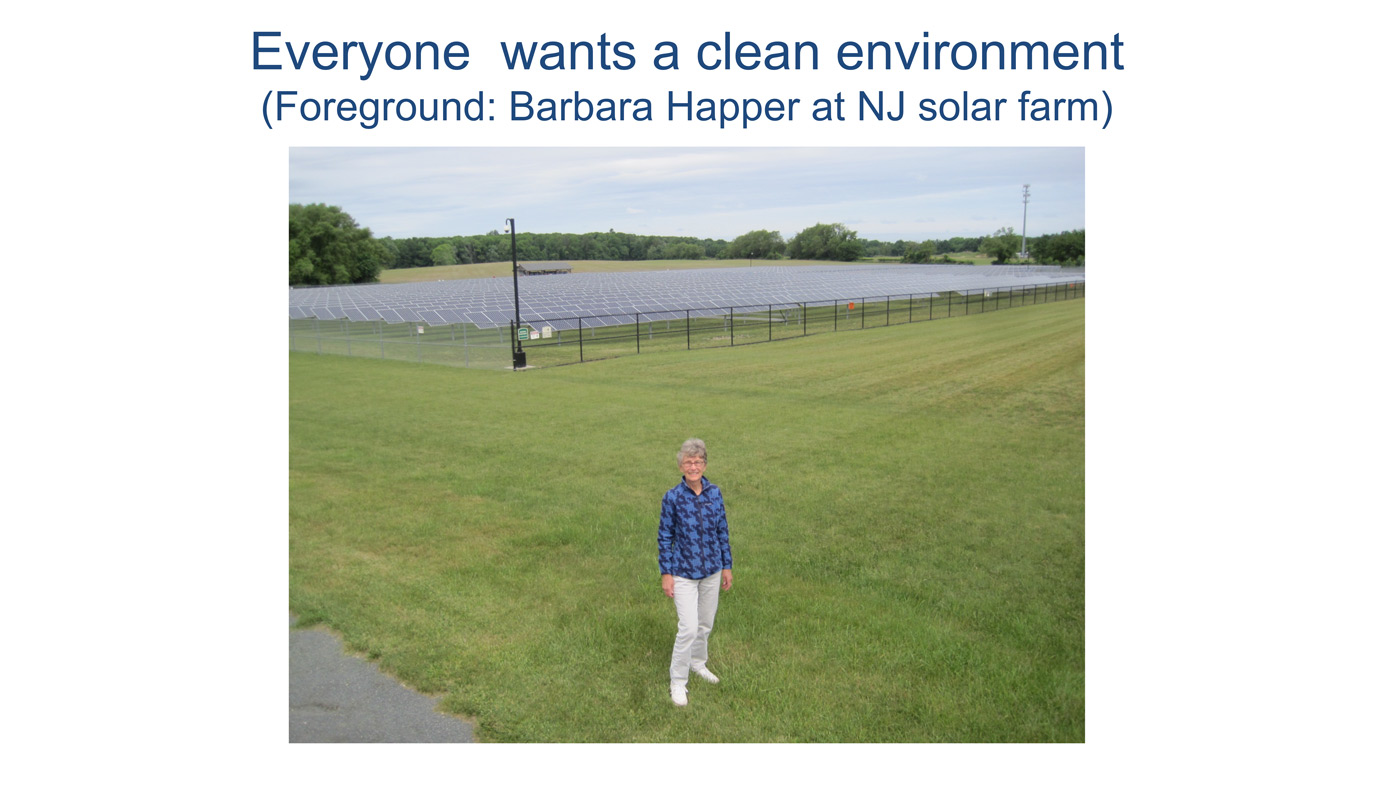
This is a picture of my wife Barbara in New Jersey near a new solar farm. We have just seen how well solar farms and windmills work in Texas in last week’s cold spell. They never did work terribly well. We have to be grateful to Nature. She seems to have a sense of humor, and she has taught us a good lesson—I hope. People seem to be slow learners. A major problem with renewable energy sources (solar, wind) is that they take up a lot of space. I preferred this field when it was nice and green instead of weedy panels. It is quite weedy now. This was soon after it was built. The panels do not work at all at night. You need something else to provide electrical power at night. Solar panels do not work if it is a cloudy day. They do not work terribly well in the winter when the Sun is low. So, it is pure virtue signaling. Solar power makes no economic sense unless you are massively subsidized by the state and federal governments.
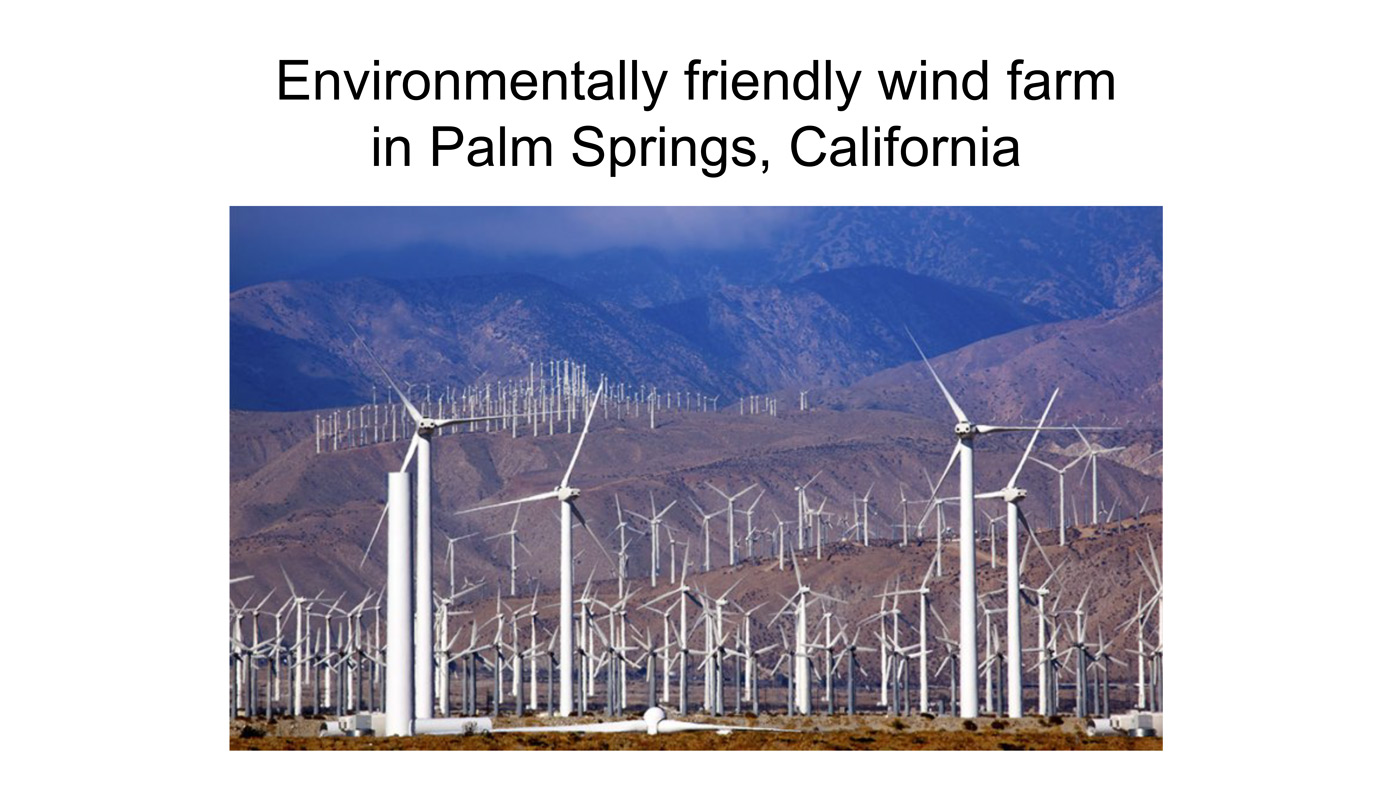
Here is an early wind farm in California. It is beginning to fall to pieces, but all wind farms fall to pieces. Nobody quite knows how we are going to dispose of all of this junk when it no longer works. Wind has much the same problems as solar. When I was a kid, people did not sit in front of computer screens all day and look at simulations of the world. You could go outside and look up at the clouds and see what the weather was like. And in those days, people knew that “the wind bloweth where it listeth.” Sometimes it blows, sometimes it doesn’t. Last week in Texas, the wind didn’t blow very much. And, when it was trying to blow the wind turbine blades were iced over and did not turn.
Renewable energy is what I would call the inverse Robin Hood strategy—you rob from the poor to give to the rich. Utilities are permitted to raise rates because of their capital investments in inefficient, unreliable renewables. They junk fully depreciated coal, gas and nuclear plants, all of which are working beautifully, and producing inexpensive, reliable energy. But regulated profits are much less. Taxpayers subsidize the rich, who can afford to lease land for wind and solar farms. Tax incentives pander to the upper class who live in gated communities and can afford to buy Tesla electric cars. They get subsidies from the state and federal government. They even get subsidized electrical power to charge up their toys. The common people have little spare income for virtue signaling. They pay more and more for the necessities of life in order to subsidize their betters.
You cannot spend a lifetime as a professor and not relapse from time to time into giving a classroom lecture. So, you will have to expect to be lectured for a few minutes. The good news is that there will be no quiz. But for those of you who share my view that this climate hysteria is serious nonsense, it helps to know what the facts are. I hope I can arm some of you with the real scientific facts.
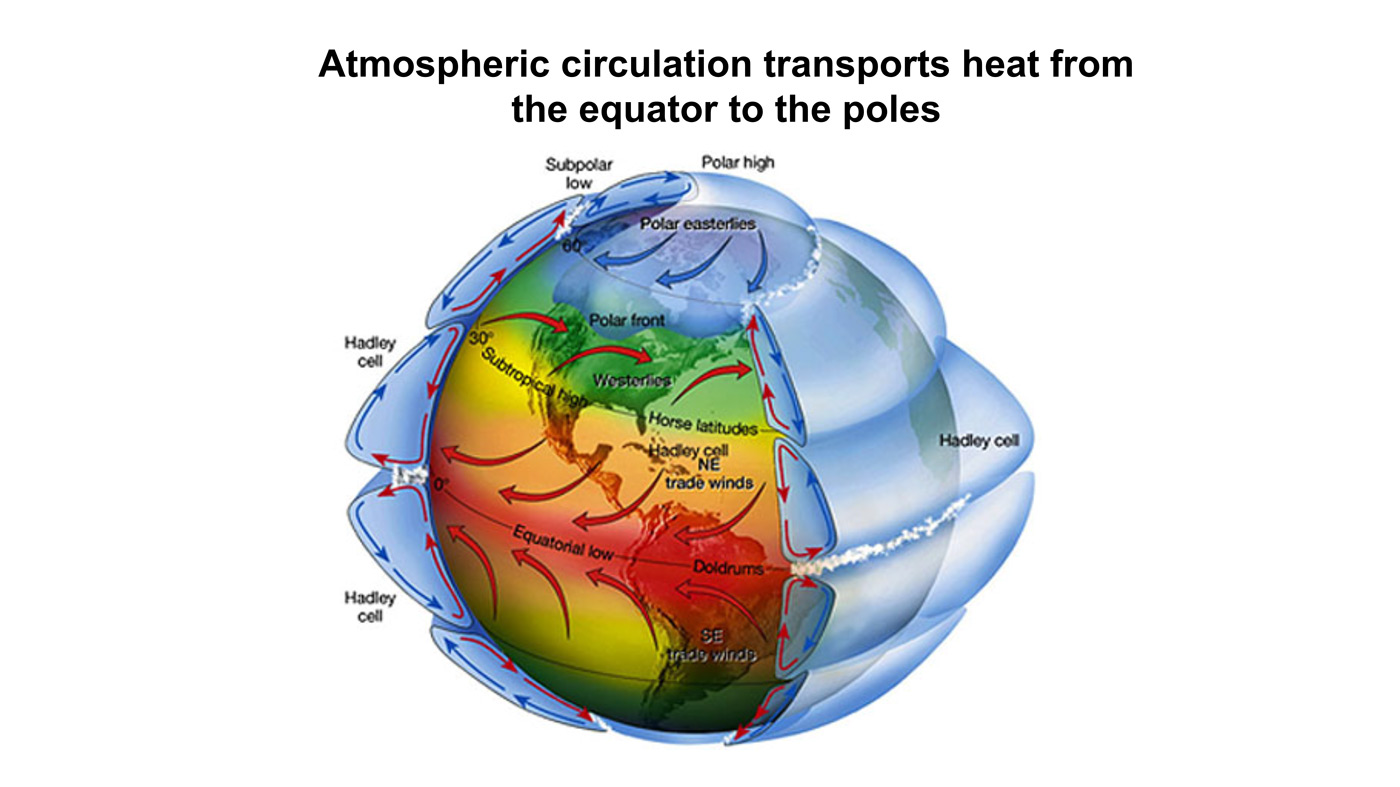
This is a picture of the overall circulation of the atmosphere around the Earth. What keeps us warm on Earth is the Sun. Everybody knows that things warm up when the Sun comes out at dawn, and it is nice and warm, at least in summertime, through the early afternoon. It normally cools off at night after sunset. The Earth is most intensely heated in the tropics. That is the reddish area on this chart, where the Sun is most nearly overhead at noon. There is more solar energy coming in at the tropics than goes out as cooling radiation to space. The excess heat must be convected to polar regions by warm air and ocean water.
Like the Sun, the Earth also radiates. If you have had dinner here at the Marriott, maybe you sat under some of the infrared radiators on the outside patios. You cannot see it, but you can feel the warm, thermal radiation from the patio heaters. Earth maintains its temperature by balancing the solar heating during the day with thermal radiation cooling to cold space, both during the day and night.
Climate involves a complicated interplay of the sunlight that warms us, and thermal infra-radiation that escapes to space. Heat is transported from the tropics to the poles by the motion of warm air and ocean water. We all know about the Gulf Stream that carries huge amounts of heat to northern Europe, even to Russia. Movements of air in the atmosphere also carry a lot of heat, as we know from regular cold spells and hot spells.
If you look at the viewgraph, you can estimate where Phoenix is, just over the Mexican border. That is where the color changes from yellow to green. This area is often under the descending branch of the Hadley Cell, air that rises up near the Equator, hot air, moist air, full of water vapor. There is tremendous rainfall down there. As the air rises to really high altitudes, 10 to 15 kilometers, most of the water is wrung out. Some of this freeze-dried air heads north and some heads south. The air that heads north eventually falls back down to the Earth, often onto Phoenix. On average, this dry air pours down at latitudes around 30 degrees north and 30 degrees south of the Equator. That is where we find the great desert belts of the Earth. That is where the Sahara Desert is, the Chihuahuan Desert, and to the south, the Kalahari Desert. The Hadley circulation is like the gas flow loop of a giant, Brayton-cycle heat engine. Over most of its path, the circulating air does not turn any wind-turbine blades.
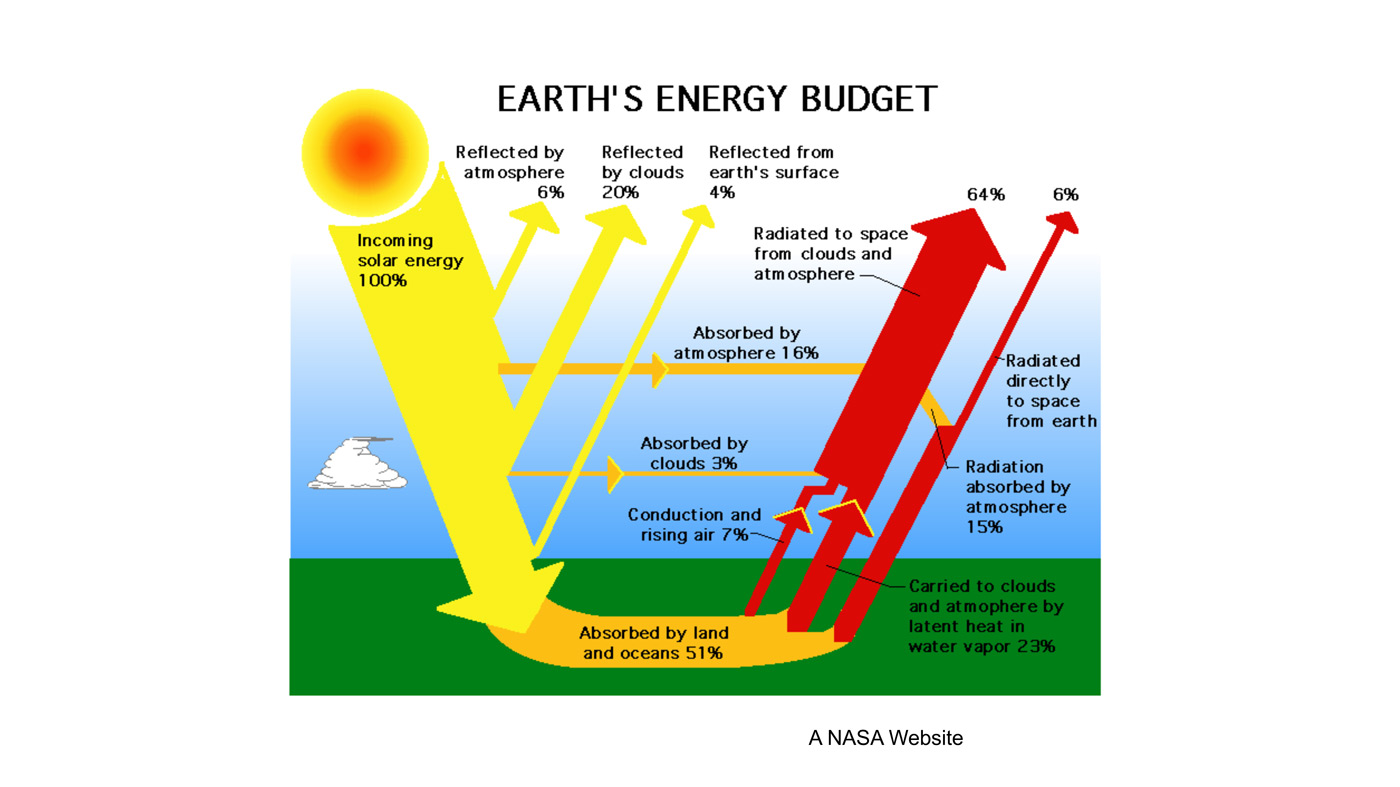
Here is a picture of Earth’s energy budget. I mentioned we are warmed by the Sun. About half of the sunlight eventually gets to the surface. What prevents it all from reaching the surface are clouds and a small amount of scattering and absorption by the atmosphere. Other parts of America, like New Jersey, now are covered with clouds. Those areas do not get any sunlight directly. But the half of sunlight that does reach the ground heats it. You can notice that in the afternoon, if you go outside. If you are a gardener like me, you can put your hands in the soil and it is nice and warm. It makes the corn grow. But that heat has to be released. If you keep adding heat to the ground, it gets hotter and hotter. So, the heat is eventually released by radiation into space which is that red arrow going up on the viewgraph. But for the first few kilometers of altitude, a good fraction of that heat is not carried by radiation, but by convection of warm, moist air. CO2 has no direct effect on convection near the surface. But once you get up to 10 kilometers or so, most of the heat is transported by radiation.
By the way, I have the meter running now. Remember that the outside air is 400 parts per million CO2. I am not sure you can see the meter but I will read it for you. It is 580 in here. It is not a whole lot higher than the 400 outside. It was at 1,000 parts per million where we were having lunch. CO2 levels are never stable near Earth’s surface. People are panicking about one or two parts per million of CO2. Now, the meter reads 608 parts per million—that is probably because I breathed on it. Hot air sets it off. I sometimes take the meter out onto my back porch. At the end of a summer day the CO2 levels on my back porch drop to maybe 300 parts per million, way below the average for outside air. That is because the trees and grass in my backyard have sucked most of the CO2 out of the local air during the day. If I get up early the next morning and I look at the meter, it is up to 600 parts per million. So just from morning to night CO2 doubles in the air of my back yard. Doubles and halves, doubles and halves. At least during the growing season that is quite common. And we have these hysterics about CO2 increasing by 30 or 40 percent. It is amazing.
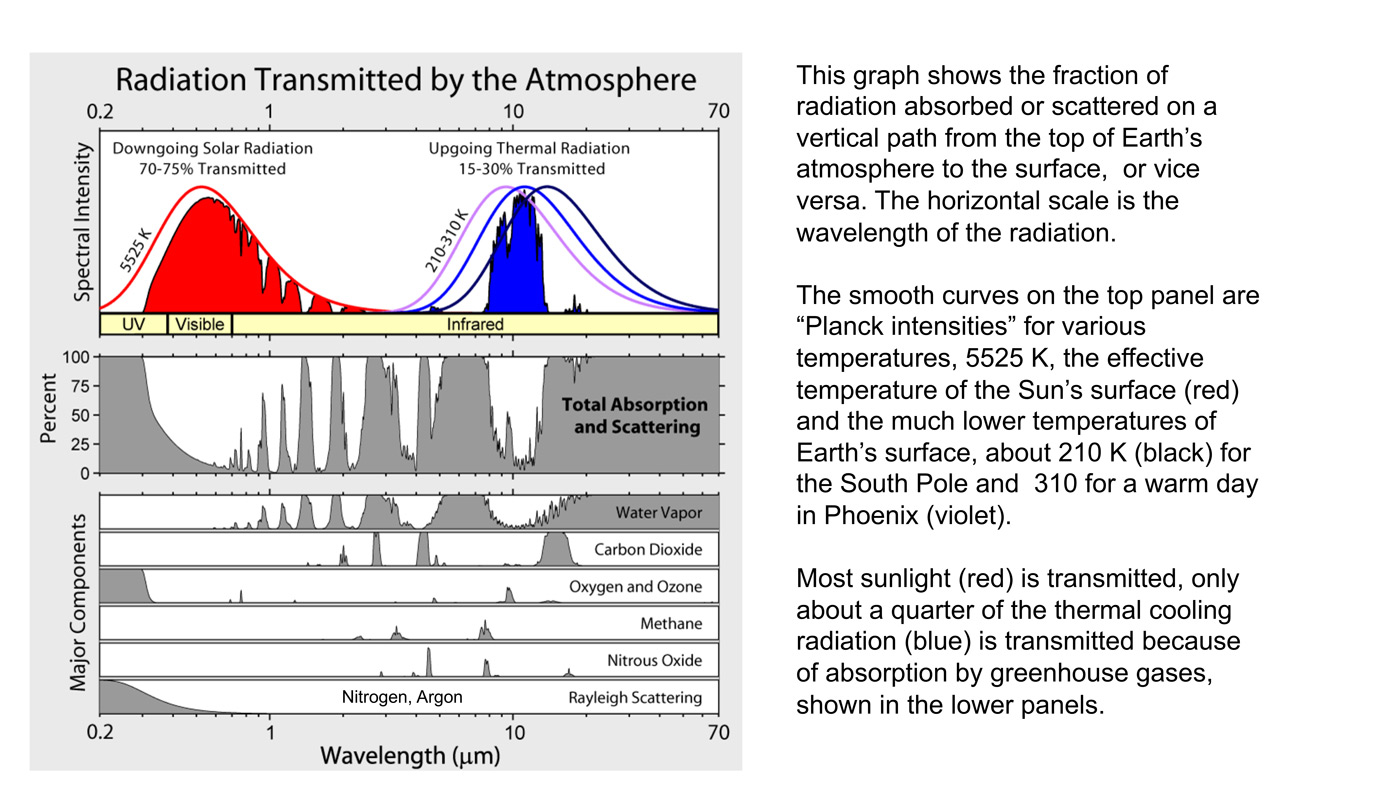
So, why the frenzy over CO2? It is because it is a greenhouse gas. That is true. This is a somewhat deceptive picture. What it shows in red is sunlight, and the horizontal scale on the top panel is the wavelength of the sunlight. Radiation wavelengths for sunlight are typically about a half a micron (half a millionth of a meter). That is green light, the color of green leaves. The thermal radiation that cools the Earth is that blue curve to the right of the upper panel, and that is a much longer wavelength, typically around 10 microns. So, the wavelength of thermal radiation is 10 to 20 times longer than the wavelengths of sunlight. It turns out that the sun’s energy can get through the Earth’s atmosphere very easily. So essentially all sunlight or at least 90 percent, if there are no clouds, gets to the surface and warms it. But radiation cooling of the surface is less efficient because various greenhouse gases (most importantly water vapor, which is shown as the third panel down, and CO2, which is the fourth panel down) intercept a lot of that radiation and keep it from freely escaping to space. This keeps Earth’s surface temperature warmer than it would be (by about 20 or 30 degrees). The Earth would be an ice cube if it were not for water vapor and CO2; and when I say water vapor, you should understand that I really mean water vapor and clouds, the condensed form of water. Clouds are at least as important as greenhouse gases and they are very poorly understood to this day.
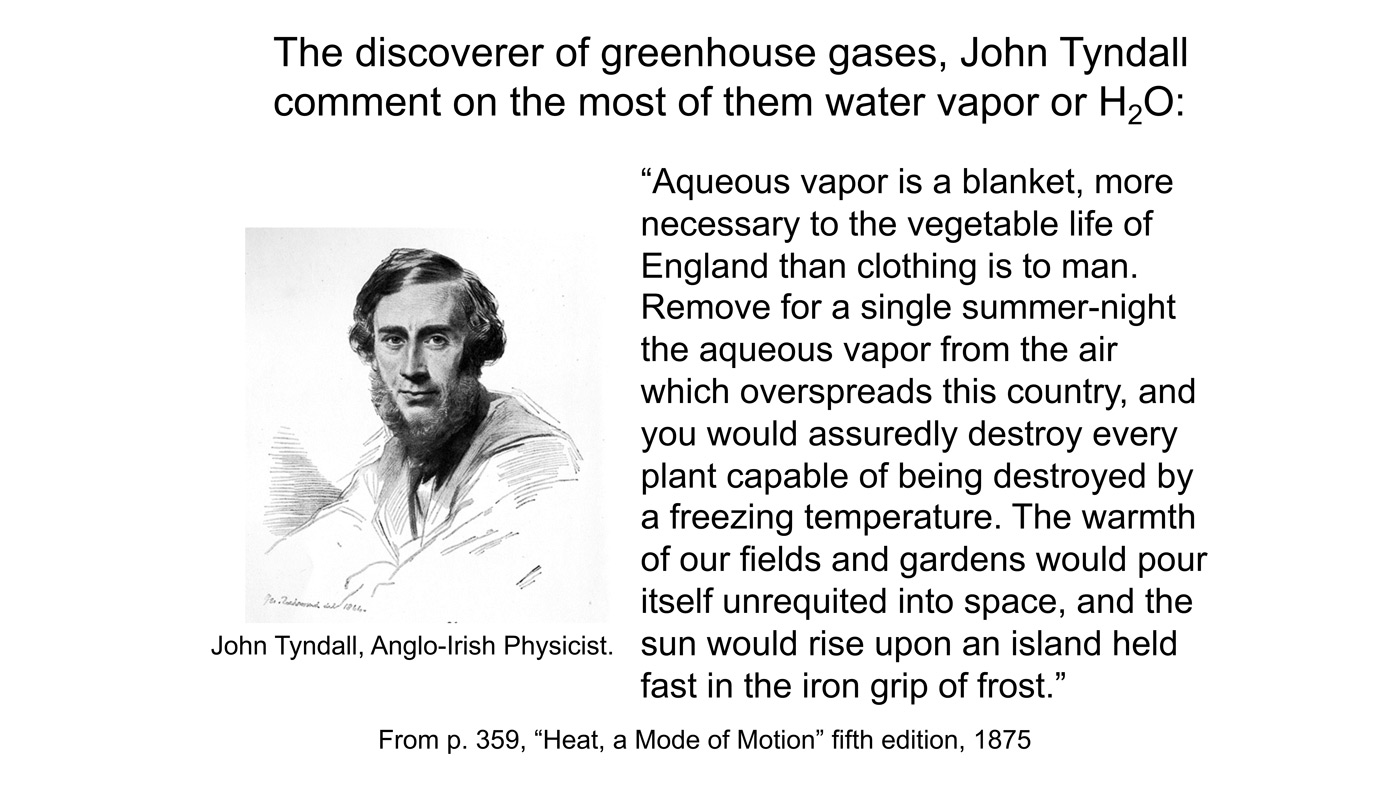
Greenhouse gases were discovered in the 1850s by John Tyndall, who was an Anglo-Irish physicist working in London, he was the first one to discover that water vapor, or carbon dioxide, or ether vapor, or alcohol vapor, intercept thermal radiation. Appropriately for an Anglo-Irishman, he used a hot tea kettle as his source of heat. He measured the thermal radiation from the tea kettle that passed through a pipe containing various gases, and he noticed that certain gases like CO2, or especially water vapor, would block much of that heat radiation whereas the normal atmospheric gases nitrogen and oxygen would not. All atmospheric gases are transparent to sunlight, but greenhouse gases are partly opaque to thermal radiation. We now call the gases that block heat-radiation “greenhouse gases.” CO2 is indeed a greenhouse gas. But it is not a very good greenhouse gas at today’s concentration. Let me show you something that I want you to remember.
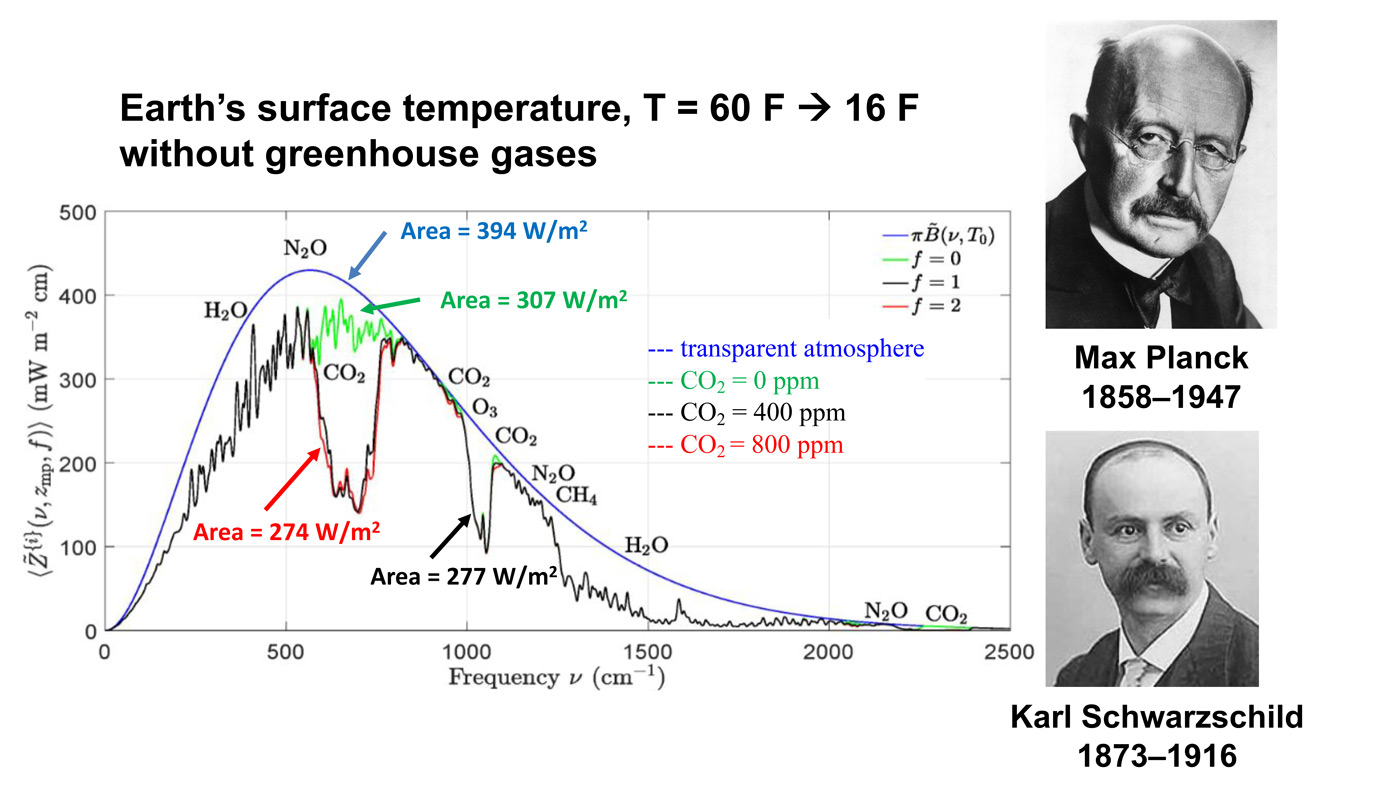
This is an important slide. There is a lot of history here and so there are two historical pictures. The top picture is Max Planck, the great German physicist who discovered quantum mechanics. Amazingly, quantum mechanics got its start from greenhouse gas-physics and thermal radiation, just what we are talking about today. Most climate fanatics do not understand the basic physics. But Planck understood it very well and he was the first to show why the spectrum of radiation from warm bodies has the shape shown on this picture, to the left of Planck. Below is a smooth blue curve. The horizontal scale, left to right is the “spatial frequency” (wave peaks per cm) of thermal radiation. The vertical scale is the thermal power that is going out to space. If there were no greenhouse gases, the radiation going to space would be the area under the blue Planck curve. This would be the thermal radiation that balances the heating of Earth by sunlight.
In fact, you never observe the Planck curve if you look down from a satellite. We have lots of satellite measurements now. What you see is something that looks a lot like the black curve, with lots of jags and wiggles in it. That curve was first calculated by Karl Schwarzschild, whose picture is below Planck’s picture. Schwarzschild was an officer in the German army in World War I, and he did some of his most creative work in the trenches on the eastern front facing Russia. He found one of the first analytic solutions to Einstein’s general theory of relativity while he was there on the front lines. Alas, he died before he got home. The cause of death was not Russian bullets but an autoimmune disease. This was a real tragedy for science. Schwarzschild was the theorist who first figured out how the real Earth, including the greenhouse gases in its atmosphere, radiates to space. That is described by the jagged black line. The important point here is the red line. This is what Earth would radiate to space if you were to double the CO2 concentration from today’s value. Right in the middle of these curves, you can see a gap in spectrum. The gap is caused by CO2 absorbing radiation that would otherwise cool the Earth. If you double the amount of CO2, you don’t double the size of that gap. You just go from the black curve to the red curve, and you can barely see the difference. The gap hardly changes.
The message I want you to understand, which practically no one really understands, is that doubling CO2 makes almost no difference. Doubling would replace the black curve by the red curve. On the basis of this, we are supposed to give up our liberties. We are supposed to give up the gasoline engines of our automobiles. We are supposed to accept dictatorial power by Bernie Sanders and Ocasio-Cortez, because of the difference between the red and the black curve. Do not let anyone convince you that that is a good bargain. It is a terrible bargain. The doubling actually does make a little difference. It decreases the radiation to space by about three watts per square meters. In comparison, the total radiation to space is about 300 watts per square meter. So, it is a one percent effect—it is actually a little less than that, because that is with no clouds. Clouds make everything even less threatening.
Finally, let me point out that there is a green curve. That is what happens if you take all the CO2 out of the atmosphere. No one knows how to do that, thanks goodness, because plants would all die if you took all the CO2 out of the atmosphere. But what this curve is telling you is that the greenhouse effect of CO2 is already saturated. Saturation is a jargon term that means CO2 has done all the greenhouse warming it can easily do. Doubling CO2 does not make much difference. You could triple or quadruple CO2 concentrations, and it also would make little difference. The CO2 effects are strongly saturated.
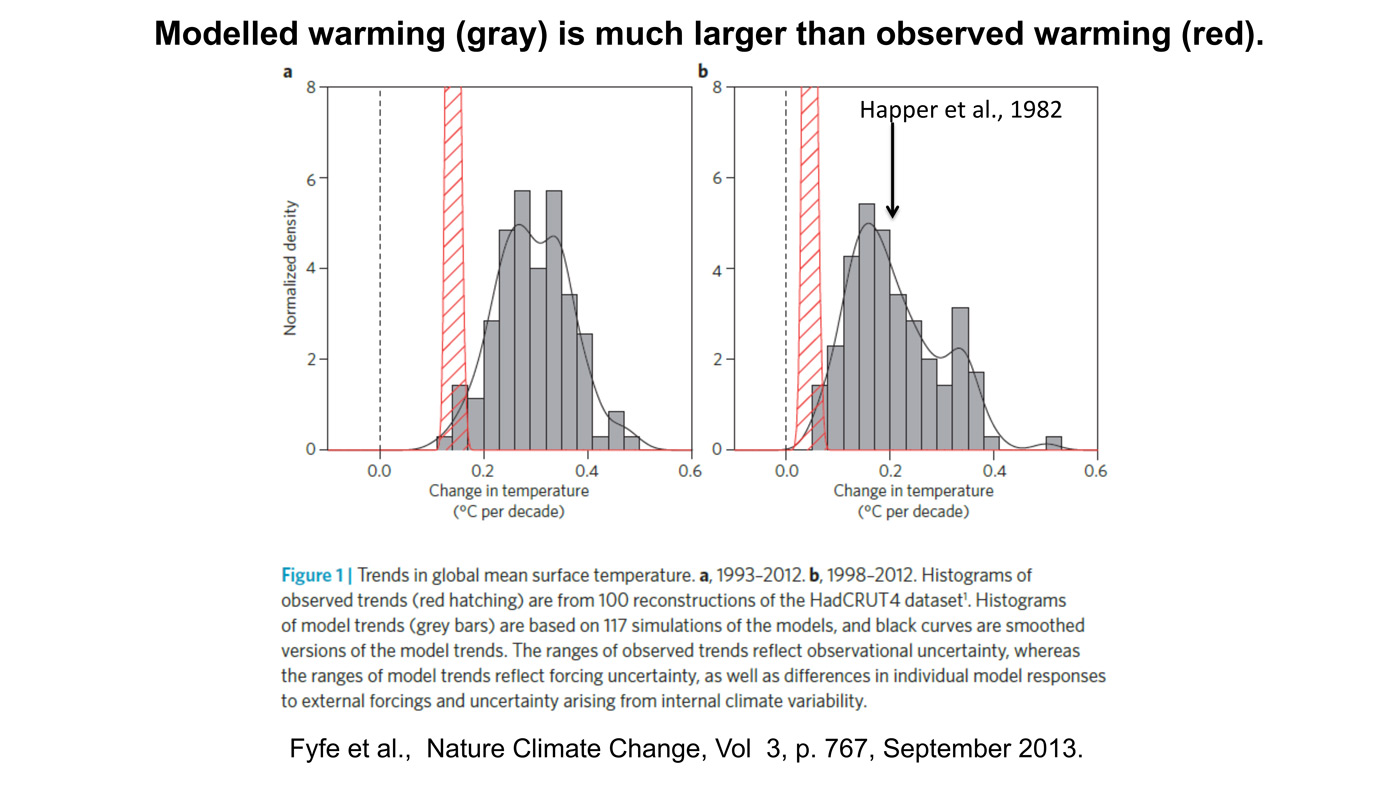
You can take that tiny difference between those curves that I showed you, the red and the black curves, and calculate the warming that should happen. I was one of the first to do this: in 1982 I was a co-author of one of the first books on radiative effects of CO2. On the right panel is my calculation and lots of other people’s calculations since. It is a bar graph of the warming per decade that people have calculated. The red bar is what has actually been observed. On the right is warming per decade over 10 years, and on the left, over 20 years. In both cases the takeaway message is that predicted warmings, which so many people are frantic about, are all grossly larger than the observed warming, which is shown by the red bars. So, the observed warmings have been extremely small compared to computer calculations over any interval that you consider. Our policies are based on the models that you see here, models that do not work. I believe we know why they do not work, but no one is willing to admit it.

Here is another comparison of models and observations. The red curve here on the bottom is the year. I think it starts in 1975. It goes through 2025 because model predictions are included. The top curve is predictions by the international climate-alarm establishment, and the bottom blue and green curves are observations. The blue circles summarize temperatures measured with balloons. You probably know that every day thousands of balloons are launched around the world in North America, Europe, Asia, and the southern hemisphere. They measure the temperature as they rise up to the stratosphere. So, we know what the temperature of the atmosphere has been from these really good balloon records. The warming observed from balloons is about a third of the warming that has been predicted by models.
Nobody knows how much of the warming observed over the past 50 years is due to CO2. There is good reason to that think much of it, perhaps most of it, would be there even without an increase in CO2 because we are coming out of the Little Ice Age. We have been coming out of that since the early 1800s, before which the weather was much colder than now. The green curve is measurements from satellites, very much like the measurements of a temporal scanning thermometer. You can look down from a satellite and measure the temperature of the atmosphere. The satellites and balloons agree with each other, and they do not agree with the computer models. This is very nice work by John Christie at the University of Alabama-Huntsville.
The alleged harm from CO2 is from warming, and the warming observed is much, much less than predictions. In fact, warming as small as we are observing is almost certainly beneficial. It gives slightly longer growing seasons. You can ripen crops a little bit further north than you could before. So, there is completely good news in terms of the temperature directly. But there is even better news. By standards of geological history, plants have been living in a CO2 famine during our current geological period.
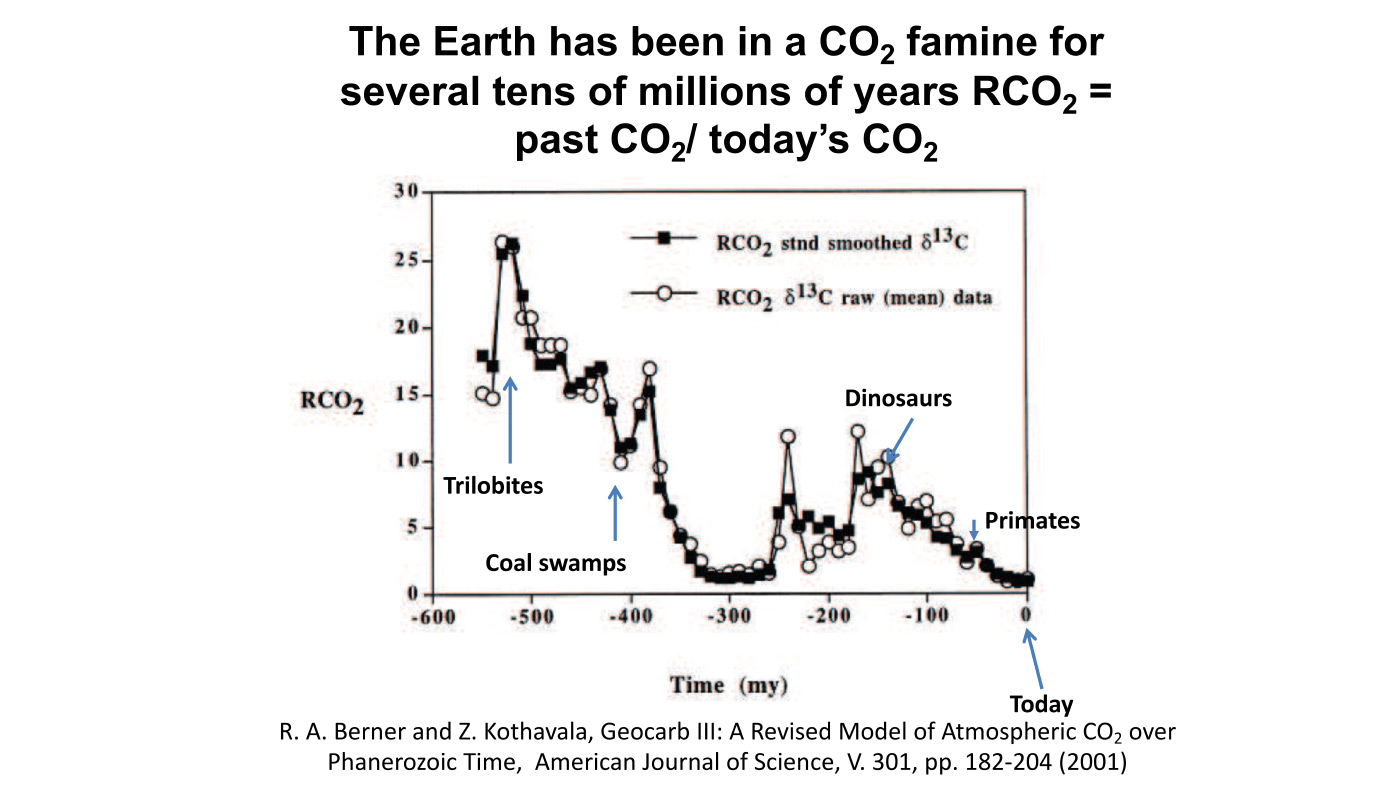
This is a picture of our best estimate of past levels of CO2. The vertical scale, RCO2, is the amount of that CO2 in the past that was greater than it is today. You can see on that scale that over most of the past, CO2 levels have been five times, ten times. even twenty times greater than today. This period, approximately the past 540 million year since the Cambrian Period, is the Phanerozoic Eon, when we have good fossil records of life on Earth. So, we know pretty well what life was doing during that time from the sediments. During all of this period, with much higher CO2 levels, life flourished on Earth. In general, it flourished better when there was more CO2. Plants really would prefer to have two, three, four times more CO2 than we have today, and you can see plants already responding to our currently increasing CO2 levels.
Let me show you an example.
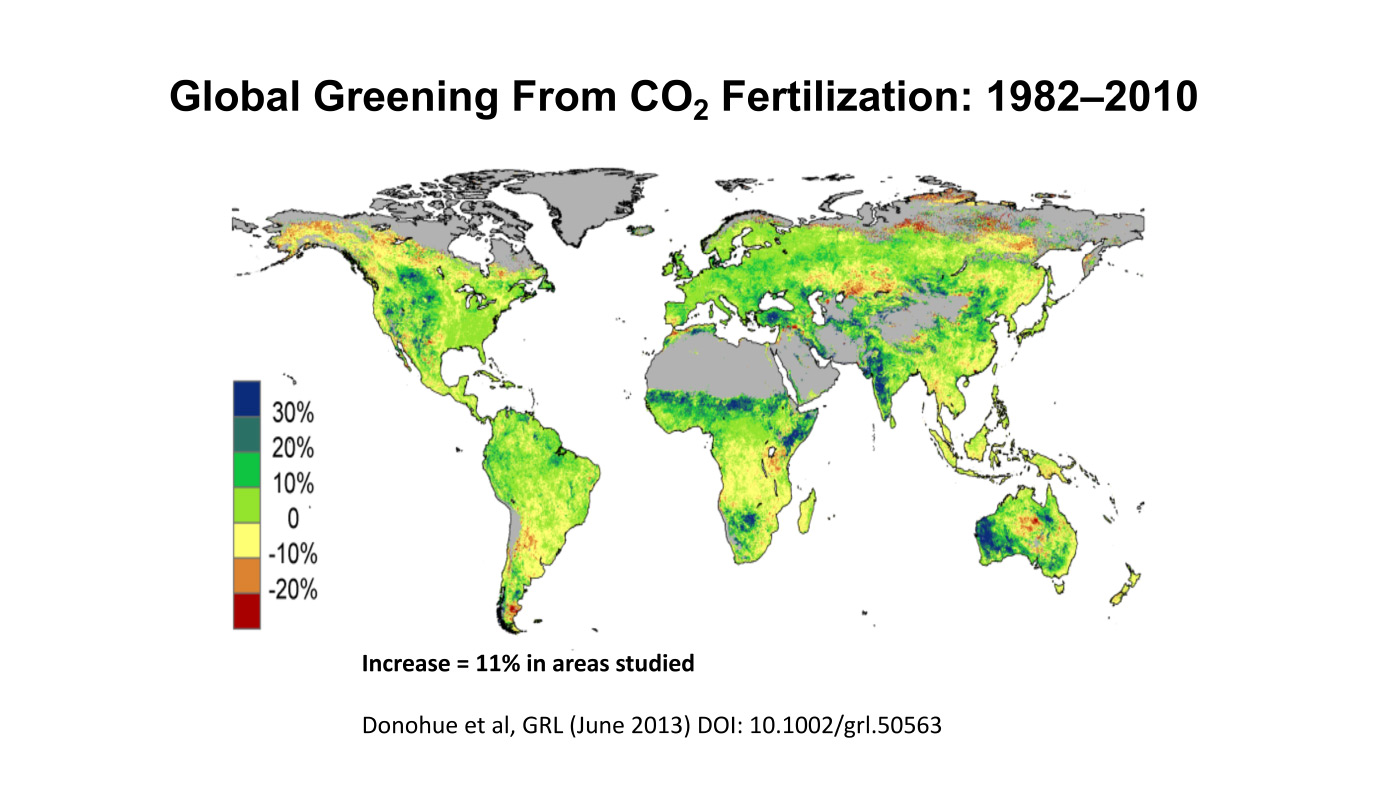
This is the greening of the Earth measured from satellites. This picture shows areas of the Earth that are getting greener over the 20-year period. What you notice is that everywhere, especially in arid areas of Sahel (you can see that just south of the Sahara) it is greening dramatically. The western United States is greening, western Australia is greening, western India is greening. This is almost certainly due to CO2, and the reason this happens is that CO2 allows plants to grow where 50 years ago it was too dry. Plants are now needing less water to grow than they did 50 or 100 years before.
Let me show you another example of what more CO2 does in terms of making plants grow better.
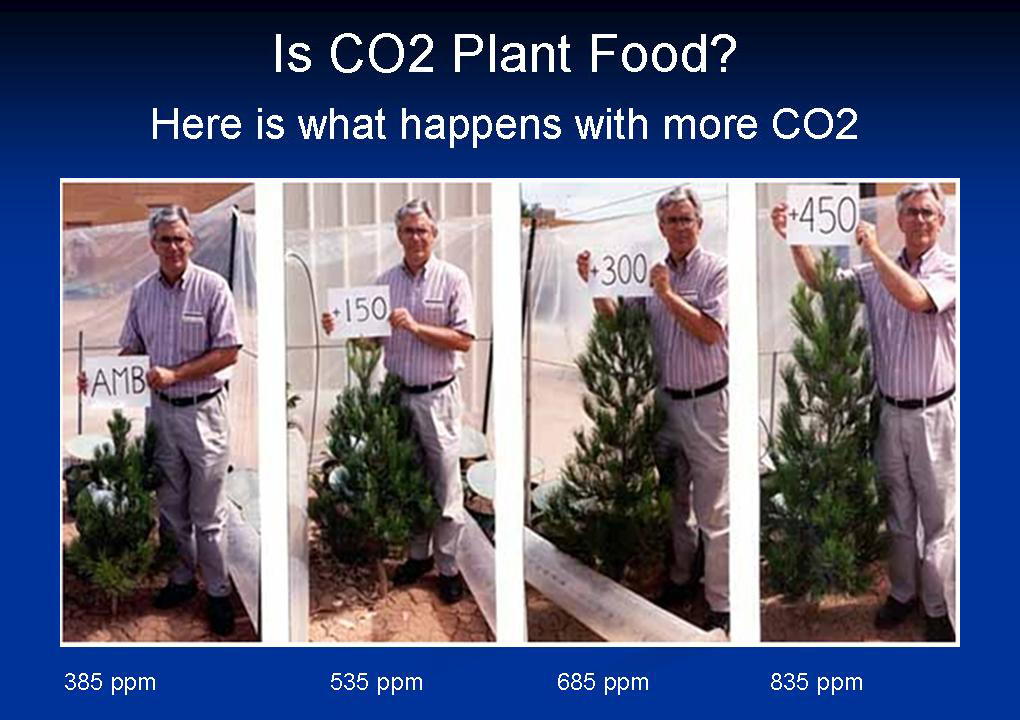
This is a picture of Dr. Sherwood Idso, and it was actually an experiment done here in Phoenix back in the 1980s. This pine tree, I believe, is a Mediterranean variety, the Eldarica pine. On the left is a pine tree growing in the current CO2 level at that time, which was about 380 parts per million, and on the right are pine trees growing in higher and higher CO2 concentrations. You can see that the more CO2 the pine trees have available, the faster they grow. You can do this with almost any plant. Corn, wheat, cotton—they all grow better with more CO2. This is the so-called pollutant that you hear about in connection with the climate “emergency.”
So, let me explain the basics of why that works.
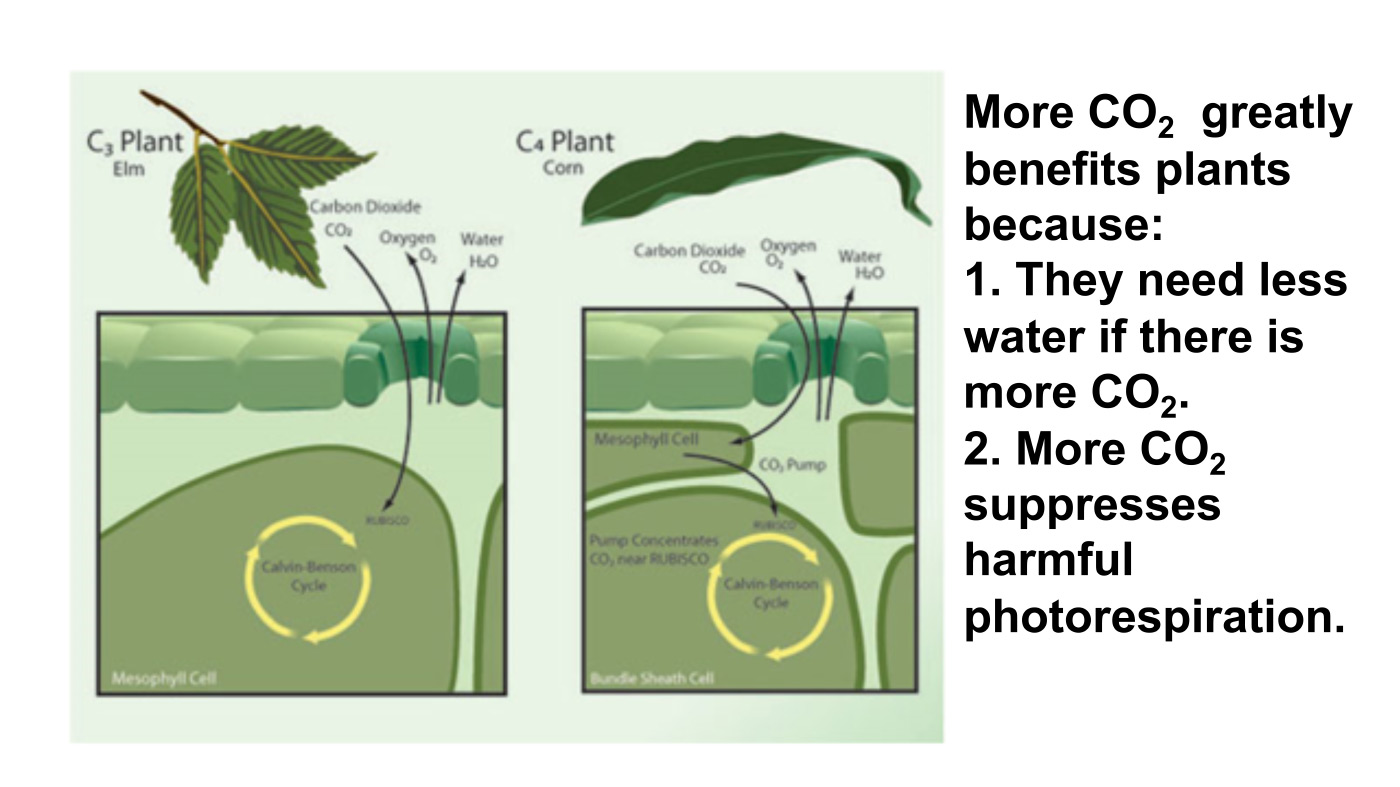
Take a low-power magnifying glass and you will see the leaf is full of little holes or “stomata.” The little holes are to let carbon dioxide diffuse from the air into the moist interior of the leaf, where the leaf, using the special enzyme called rubisco, (one of the most ancient enzymes in the world and the most abundant protein), combines CO2 with a water molecule, H2O, to make sugar. The energy to run this little chemical factory within the leaf is provided by sunlight. The problem with this is the need for holes in the leaf. Not only do CO2 molecules diffuse in from the air, but H2O molecules diffuse out through the same hole and dry out the leaf. For every CO2 molecule that diffuses into the leaf there can be a hundred water molecules that diffuse out. So, the plant has an engineering dilemma: it has to have holes in its leaf to get the CO2 that it needs to live. But those same holes desiccate it; they dry it out, and the plant needs water to live. But plants are not stupid. All over the world, they are growing leaves with fewer or smaller holes in them in response to increasing concentrations of atmospheric CO2. If there is more CO2 in the air outside, leaves do not need as many holes, and they do not leak as much water either. That is why you are seeing the greening of the earth. It is from the plants themselves taking advantage of CO2 coming back to more historically normal levels.
There is a second important issue. The enzyme I mentioned, rubisco, is very ancient. It was probably invented, on the evolutionary scale, three and a half billion years ago. At that time, there was little oxygen in the air. So, rubisco was designed in a way that lets it be poisoned by oxygen. Plants today have a hard time when there is not enough CO2 in the air. When rubisco is charged with chemical energy to make sugar, but it cannot find a CO2 molecule, it grabs an oxygen molecule, O2, instead. It uses the oxygen to create hydrogen peroxide and other nasty oxidizing molecules. One reason for the antioxidants in your tea is to mitigate this problem. This mistaken use of an O2 molecule rather than a CO2 molecule is called photorespiration. Suppression of photorespiration is one reason plants grow better with more CO2. There is a special type of plant called C4 plant, which includes American corn and sugar cane, that has partially solved this problem. But as the CO2 levels increase, the old-fashioned C3 plants, without all the biochemical machinery to cope with photorespiration, out-compete C4 plants.
When you raise all these hard, scientific issues with the climate alarmists, the response is “how can you say that? 97 percent of scientists agree that there’s a terrible emergency here that we have to cope with.”
Here there are several things you should say. First of all, in science truth is not voted on. It is not like voting on a law. It is determined by how well your theory agrees with the observations and experiments. I just showed you that the theories of warming are grossly wrong. They are not even close and yet we are making our policy decisions based on computer models that do not work. It does not matter how many people say there is an emergency. If it does not agree with experiments and observations, the supposed scientific basis for the emergency is wrong. The claim of a climate emergency is definitely wrong.
Secondly, even when scientists agree, what they agree on can be wrong. People think of scientists as incorruptible, priestly people. They are not that at all. They have the same faults as everybody else, and they are frequently wrong.
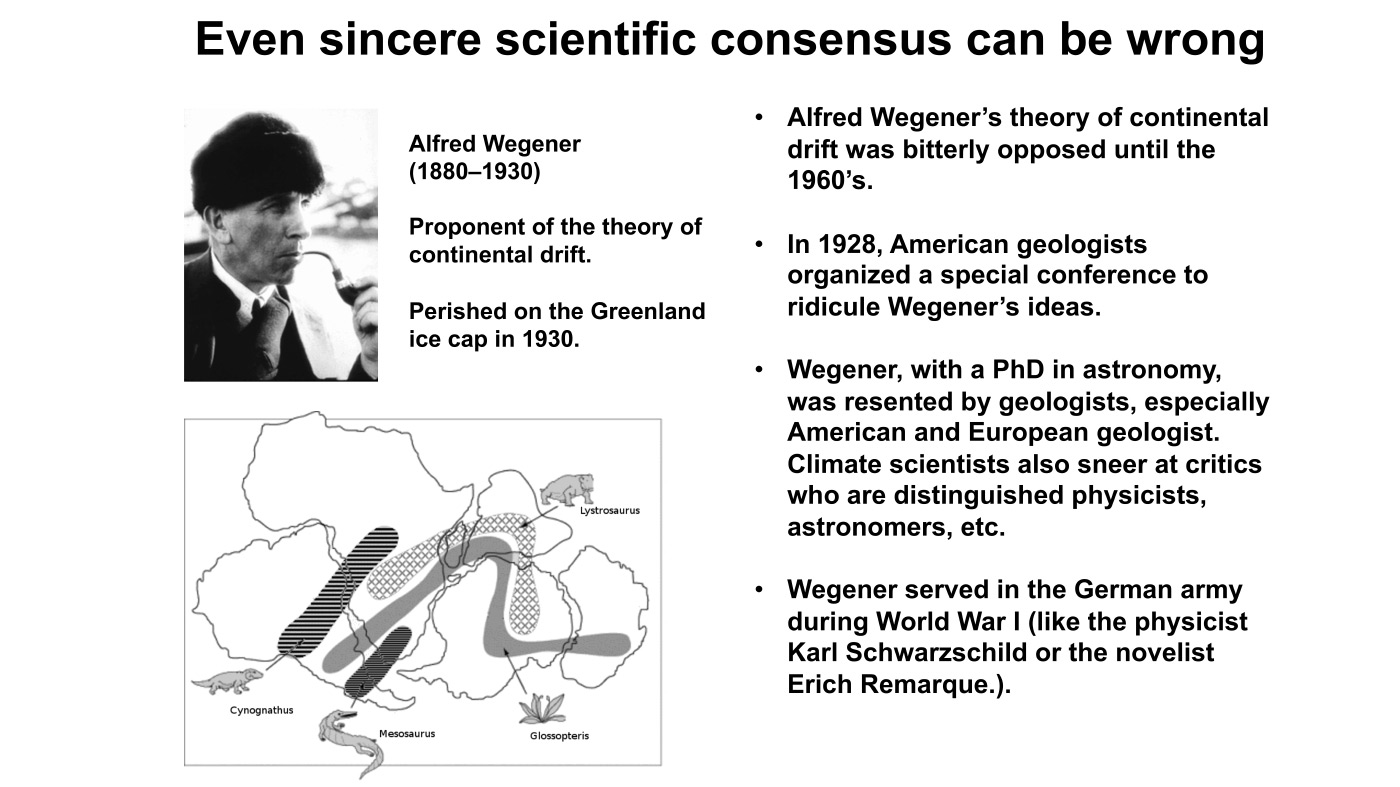
A good example of that was the theory of “continental drift.” When I was a student in the 1950s, nobody with any self-respect in geology admitted to believing in continental drift, although it had been proposed by Alfred Wegner, a German scientist in the 1920s and 1930s, and it was based on very good, hard evidence. An example shown below is the fact that Africa, South America, India and Antarctica all fit together like a jigsaw puzzle. It is as though the jigsaw has been taken apart so that is pretty suggestive. Secondly, if you look at the fossils in these continents from 300 million years ago, 400 million years ago, they go smoothly from South America to Africa or from Africa to India or even into Antarctica. You find fossils of the same organisms even though there are thousands of kilometers of sea separating them today. That again suggests that these land masses were connected. Nevertheless, in spite of this quite persuasive evidence, Wegner was scorned and mocked all his life. He died falling into a crevasse in Greenland, exploring and looking for fossils. A sad ending.
The clincher actually came when the USA finally declassified the World War II North Atlantic Magnetic Anomaly data which we had been sitting on for 10 years. The data showed mirror-image conveyor belts of newly-formed oceanic crust, starting at the mid-Atlantic ridge and going out left and right toward America, and toward Europe. So, there was absolutely no question that the seafloor was spreading. That is the one bit of evidence that Wegner did not have, but he had lots of other evidence that should have persuaded people.
This is just one example. I could tell you about many other scientific consensuses that made no sense. This one is interesting because it had no political background. It was pure science, but it does illustrate the fallibility of scientists, and the group-think that goes on in science. If you wanted to advance as a young geologist you could write a paper scorning Wegner in 1950 and get promoted right away, even though your paper was completely wrong. And, once you get tenure, you are there for good.
So, the takeaway message is that policies that slow CO2 emissions are based on flawed computer models which exaggerate warming by factors of two or three, probably more. That is message number one. So, why do we give up our freedoms, why do we give up our automobiles, why do we give up a beefsteak because of this model that does not work?
Takeaway message number two is that if you really look into it, more CO2 actually benefits the world. So, why are we demonizing this beneficial molecule that is making plants grow better, that is giving us slightly less harsh winters, a slightly longer growing season? Why is that a pollutant? It is not a pollutant at all, and we should have the courage to do nothing about CO2 emissions. Nothing needs to be done.
Q&A
QUESTION: A very interesting conversation. One of the things that the environmentalists always forget is the tremendous amount of CO2 that is produced to get the raw materials to make the wind turbines, to make the solar cells. But another thing that I have thought about and never seen discussed is that every one of those things takes heat out of the atmosphere. Has anybody ever figured that out? The second thing is we talk about the rise of the ocean, of the sea level. Everything we put into the ocean raises the sea level a little bit, and all of the mud that flows off the land raises the sea level. They think it just comes out from glacier melting, but it is much more complicated than that.
HAPPER: Thank you. It is true that anything you make in our modern world involves CO2 production. Or sometimes the carbon actually goes into the product. Plastics are made of carbon. My coat is made of carbon. The amount of carbon going into materials is not negligible. But the biggest source of CO2 is burning fossil fuels to get energy, for transportation mostly, but also for electrical power and space heating. Another non-trivial part is cement making. The way you make cement is to take limestone, which is calcium carbonate, and “baking out” the CO2 to make “burnt lime.” You have to burn oil or coal to heat the lime kilns for baking. So, you get a double whammy of CO2 from cement manufacturing. I would call it a double benefit, because as I have said, CO2 is really good for life on Earth. Plants love more CO2. We are happy with more CO2 too. We know a lot about how it affects humans. The amounts we are talking about do not affect us at all.
As for the sea level, sea levels started to rise around 1800, at the end of the Little Ice Age, and they have been rising steadily at about two millimeters per year. Two millimeters is not very much—you can barely see it. That is maybe nine inches a century. If you go to the sea shore, the typical rise and fall of the tide is quite a bit more than nine inches. If nine inches is going to bother you, you have been swindled in the real estate market. Nobody knows how long this rise will continue—it could easily go for another century or it could stop in a couple of years.
When I was having lunch with someone recently, they asked what is interesting in basic science, and one of the more interesting things is speculations that solar activity is beginning to decrease. If you look at sunspot activity, it is definitely less the last few years, and we have had these rather cold winters the last few years. One of the possible drivers of climate is solar activity. So, is there really going to be a cooling period? We had a cooling period for example in the 1970s. I remember then reading about the coming ice age in Newsweek and Time. Then they flipped immediately, about 10 years later. In physics, we have a joke which says that the hardest thing about a theory is getting the sign right. That is been true of climate for a long time. Anyway, it could cool in another 10 or 15 years. I do not have a strong opinion on that one way or the other.
QUESTION: I understand that the original idea was that CO2 would cause a slight warming, which would cause more water vapor, which was the big greenhouse gas, which would cause still more water vapor and more heating, etc., and a runaway situation. If the only effect of the CO2 was to increase the temperature and start that cycle, shouldn’t the reality have been kind of obvious, since the Earth has been a lot warmer previously, and it did not start to boil?
HAPPER: Absolutely, the reason the models get these huge numbers—and mine had the same flaw—is because of the water vapor feedback. I think the reason those feedbacks are overestimated is that they do not treat clouds correctly. I have worked personally on this so I know a lot about it. You cannot increase water vapor without affecting clouds, and a change of just a few percent in cloudiness completely overwhelms any change from CO2 or water vapor. We are all familiar with the fact that if it is a hot summer day and a cloud comes over, it cools down. And, if you take that on a global scale, it turns out that there is exquisite sensitivity to cloudiness.
Just to follow up on another allusion you made, if there really were this positive feedback, the Earth’s climate could not be as stable as the geological record indicates. The temperature would be shooting up and down, up and down, all of the time; for example, because of changes in solar output to which I alluded. But that is not observed. The Earth’s climate turns out to be remarkably stable. If there are feedbacks, they may well be negative feedbacks, and they probably involve clouds.
QUESTION: I appreciate the discussion and the knowledge that you have passed on. But when I look at this issue, it is more about marketing and perception than science. Being retired, I have a chance to read these studies as they are published, and I have noticed a little trend where they make a sort of scientific statement about climate change, and two or three sentences later, they go into the projected impacts: coastal flooding, deserts everywhere, and so forth. The media of course only reads the first paragraph or whatever they are fed. So, then they publish that, and it just scares the bejesus out of people. I know I have relatives who believe this stuff, and you try and explain what you are telling us and, with new knowledge, maybe I can do that. But you can’t get through. These people, they are just scared from the perception and the marketing. So, what do we do?
HAPPER: Well, that is the key question because the scientific support for a climate emergency really does not exist. But so many people are scared now, and so many people have been brainwashed since childhood! I know. I watched our children and grandchildren in school and they get an incessant barrage of claims that the world is coming to an end. “You children are unlikely to finish your life because you are going to fry.” And all because your dad’s driving an SUV. A fair fraction of kids are sufficiently independent thinkers, in every generation, that they laugh this off. But there are lots who take it seriously. They go home, and they cannot sleep at night. You have got Greta Thunberg having hysterics in front of the mighty of the world, but she does not know anything about the real science or about the history of science. Some of my Swedish friends tell me that Greta is related to Svante Arrhenius, who was the first person to seriously try to calculate the effects of more CO2. A Swedish chemist, Arrhenius thought more CO2 would be good for Sweden. I think he would be appalled to see his great-granddaughter, or whatever the relationship may be, having hysterics in front of the whole world for something that he was convinced would be good.