The recent run-up in oil prices drew interesting reactions. A Calgary oil consultant was quoted as saying that “[l]ogic and the market are barely on speaking terms these days.” Other commentators openly blamed speculators. Hare Krishna, Hare Krishna.
Consider the data. The chart below shows the evolution of benchmark West Texas Intermediate (WTI) prices from January, 1970, to July, 2005 (in constant July, 2005, dollars, deflated with the U.S. consumer price index). Although real oil prices have been on an upward trend over the past few years, the long-term picture is different. WTI prices increased from about US$20 per barrel in the 1950s to slightly more than US$40 after 1973, when the OPEC cartel cut production in reaction to the Yom Kippur war. A peak of US$95 was reached in 1980 in the wake of the Iranian revolution and of another major production cut by the OPEC cartel.
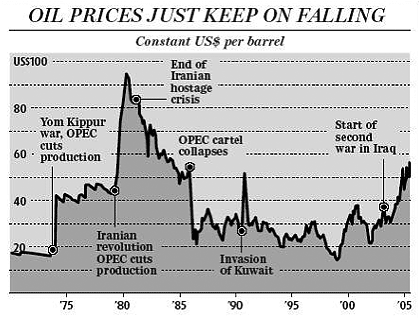
SOURCES: National post with data from Federal Reserve Bank of St. Louis and the Bureau of Labor Statistics. WTI in constant (July, 2005) U.S. dollars, January, 1970, to July, 2005.
After half a dozen years, the cartel collapsed, because its high prices had reduced quantity demanded and generated higher production from non-OPEC countries. Between 1973 and today, OPEC’s share of world production fell from 60% to 40%. After the invasion of Kuwait in August, 1990, generated another temporary peak, oil prices dropped back to less than their 1970s level.
Thus, if we exclude the peaks caused by geopolitical events, real oil prices have followed a downward trend from the mid-1970s until the late 1990s.
Starting in 2003, crude prices climbed from US$30 to around US$45 by the end of 2004. Since the beginning of 2005, they have gained another 50%. This may be related to the second war in Iraq and the general political situation in the Middle East. But note that even after the recent run-up, a barrel of oil costs about the same as in mid-1982, when prices were going down.
To explain a price increase, we need an increase in demand, a decrease in supply, or both. Supply has recently been hit by hurricanes and other interruptions in production. Demand increases have thus generated larger price increases than would otherwise have been the case. There are many indications that part of the increased demand has been driven by speculation. Speculators include motorists who fill up more frequently, home owners who order earlier their winter supply of heating oil, refiners, distributors and other intermediaries. Professional speculators merely try to anticipate future demand. All speculators render a useful arbitrage service by evening out price movements over time.
From an economic point of view, higher oil—and oil product—prices are not a problem. They convey useful information about the perceived scarcity of the resource. Owners of oil fields, refineries and other oil assets get rents, but this is simply a transfer—mainly from world consumers to Canadian producers, in the case of Canada. Part of the country benefits.
The standard forecast for oil prices is that they will stay high, even if they come down from their peak. TD Economics forecasts WTI at US$40–50 over the next three to five years, which is representative of the consensus before the August run-up. Goldman Sachs now forecasts US$60. One reason for high prices is that new supplies (from oil sands, for example) will only come at higher cost. The other reason is the increase of demand caused by the economic takeoffs of China and India.
Yet, the history of the oil industry is replete with exaggerated demand forecasts, pessimistic supply limitations and sky-high prices. The median forecast of experts polled by the International Energy Workshop in January was for crude oil prices of US$240 by 2005 (in today’s dollars). Four years earlier, the median forecast for 2000 was US$400.
Until his death in 1997, economist Julian Simon predicted a continuous decline in resource prices. In 1980, he made a famous bet with environmentalist Paul Ehrlich. Simon’s bet was that a US$1,000 basket of any five metals chosen by Ehrlich would be worth less (in constant dollars) 10 years later. Ehrlich lost. In 1990, the value of the basket at current market prices was down more than 50%. Ehrlich had to send a US$576.07 check to Simon, representing the drop in the basket value. In fact, the prices of all the metals chosen by Ehrlich had fallen.
In his challenging 1981 book The Ultimate Resource, Simon showed that resource prices had generally decreased over time. The relative price of oil (how much of other goods can be purchased with a barrel of oil) has fallen by perhaps as much as two-thirds between the 1860s and today. During the same period, the price of oil in terms of salaries has decreased by more than 90%.
Simon forecasted that the downward trend in resource prices would continue because, over the long run, the supply of resources (including oil) increases more than demand. Supply increases because of human ingenuity. Proved world reserves of oil, which were 762 billion barrels in 1984, are now estimated at 1,189 billion barrels; corresponding figures for Canada are nine and 17 billion barrels. As for the growth of demand, which normally follows population and revenue growth, Simon argued that it would be dampened by new technologies that reduce the use of oil (like lighter cars), and eventually by new materials. The value of petroleum as a proportion of finished products will continue to decrease. And contrary to Malthusian fears, population growth will spur the potential for inventions.
In the past few years, however, many resource prices—exemplified by copper—have gone up. As the saying goes, forecasting is risky, especially with regard to the future. But we know the main interacting factors in oil prices: political uncertainty in the Middle East, increased demand from rapidly developing countries (assuming that their growth continues) and the usual innovation spirit and entrepreneurship of man. We should just make sure that politics interfere as little as possible with the last factor.