The human condition lies on a vast spectrum between “miserable” and “happy.” In the economic sphere, misery tends to flow from high inflation, steep borrowing costs, and unemployment. The surefire way to mitigate that misery is through economic growth. All else being equal, happiness tends to blossom when growth is strong, inflation and interest rates are low, and jobs are plentiful.
Many countries measure and report these economic metrics regularly. Comparing them, nation by nation, can tell us a lot about where in the world people are sad or happy. Is the United States, for example, more or less miserable than other countries? Hanke’s Annual Misery Index (HAMI) gives us the answers.
The first misery index was constructed by economist Arthur Okun in the 1960s to provide President Lyndon Johnson with an easily digestible snapshot of the economy. That original misery index was a simple sum of a nation’s annual inflation rate and its unemployment rate. The index has been modified several times, first by Robert Barro of Harvard, and then by me.
My modified misery index is the sum of the unemployment, inflation, and bank-lending rates, minus the percentage change in real GDP per capita. Higher readings on the first three elements are “bad” and make people more miserable. These “bads” are offset by a “good” (real GDP per capita growth), which is subtracted from the sum of the bads. A higher HAMI score reflects a higher level of misery.
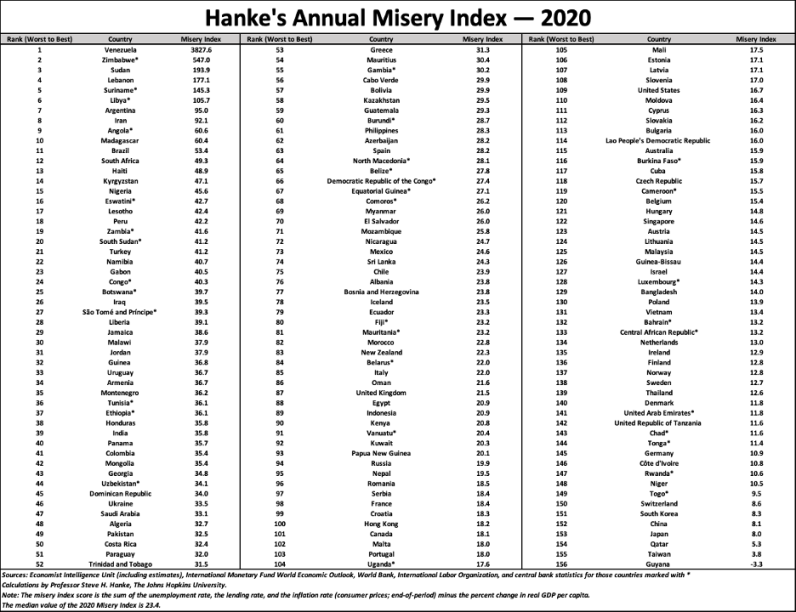
The HAMI is a simple metric that can be understood at a glance. The table for 2020 is much expanded over the one that was presented for 2019. Indeed, last year’s HAMI included 95 countries, while this year’s includes 156.
In our review of this year’s table, let’s start with three of the least miserable countries.
Guyana takes the prize as the world’s least miserable country. Guyana literally struck oil, and its percentage change in real GDP per capita in 2020 soared by a stunning 25.8 percent. Since Guyana’s huge increase in real GDP per capita represents the “good” component of the HAMI and is subtracted from the three much smaller “bad” components, Guyana’s resulting HAMI score is negative. A negative HAMI equals happiness. Here’s the arithmetic for Guyana:
HAMI = [Unemployment (11.8%) + Inflation (1.0%) + Bank-Lending Rate (9.7%)] − Real GDP Growth (25.8%) = −3.3.
Taiwan has improved and moved up in the ranks to the second-least miserable country in the world in 2020. Here’s the arithmetic:
HAMI = [Unemployment (3.8%) + Inflation (0.1%) + Bank-Lending Rate (2.5%)] − Real GDP Growth (2.6%) = 3.8.
Qatar has also upped its game in 2020 and is now the third-least-miserable country in the world. Here’s the arithmetic:
HAMI = [Unemployment (0.5%) + Inflation (-2.6%) + Bank-Lending Rate (2.8%)] − Real GDP Growth (−4.6%) = 5.3.
Now, let’s dive down into the pits.
Venezuela holds the inglorious title of the most miserable country in the world in 2020, as it did in all five preceding years. The failures of president Nicolás Maduro’s corrupt, socialist petroleum state have been well documented. But behind the shroud of secrecy that Venezuela has drawn over itself, significant changes occurred within the components of HAMI during 2020. Inflation, while still the world’s highest, plunged from 7,374 percent per year in 2019 to 3,713 percent in 2020. But the unemployment rate surged from 24 percent in 2019 to 50.3 percent. Both the bank-lending rate and real GDP growth per capita remained about the same in 2020 as in 2019. Here’s Venezuela’s miserable arithmetic:
HAMI = [Unemployment (50.3%) + Inflation (3,713.3%) + Bank-Lending Rate (33.1%)] − Real GDP Growth (−30.9%) = 3827.6.
Zimbabwe was unranked on last year’s HAMI because of a lack of reliable data. But this year its dubious accomplishment is nailing down a spot as the second-most-miserable country in the world. Zimbabwe just can’t kick its inflation addiction. Under the reign of the ruthless Robert Mugabe, the country suffered two episodes of hyperinflation. The first peaked in November 2008, when prices were doubling every 24.7 hours. It was the second-highest hyperinflation in history. In 2009, Zimbabwe officially dollarized and shook its inflation addiction. But dollarization didn’t last long. By 2017, Zimbabwe was afflicted with yet another bout of hyperinflation. Today, President Emmerson “Ed” Mnangagwa rules the way Mugabe did, and inflation continues to rob Zimbabweans, rendering them miserable. Here’s the miserable arithmetic:
HAMI = [Unemployment (4.9%) + Inflation (495.0%) + Bank-Lending Rate (35.0%)] − Real GDP Growth (−12.1%) = 547.0.
Sudan holds down the spot as the third-most-miserable country in the world on the 2020 HAMI and is in terrible shape. Indeed, at the start of 2021, the Sudanese pound was devalued by 85 percent against the greenback. This added to Sudan’s inflation fire. If that wasn’t bad enough, the country’s government and institutions remain weak, and a mass exodus of refugees from Ethiopia’s Tigray region has recently rushed into eastern Sudan, a situation that threatens to trigger violence. And speaking of violence, it erupted yet again in February of this year in Sudan’s Darfur region. Here’s Sudan’s miserable arithmetic:
HAMI = [Unemployment (25.0%) + Inflation (141.6%) + Bank-Lending Rate (16.6%)] − Real GDP Growth (−10.7%) = 193.9.
Lebanon holds down the fourth-most-miserable spot on this year’s HAMI. After the collapse of the Lebanese pound, Lebanon entered a hyperinflation in July, the first hyperinflation to visit the MENA (Middle East and North Africa) region. In addition to severe inflation, the currency crisis has resulted in banking and political crises. As the economy collapses and poverty soars, the Lebanese are predictably miserable. Here’s the arithmetic:
HAMI = [Unemployment (6.3%) + Inflation (138.0%) + Bank-Lending Rate (8.1%)] − Real GDP Growth (−24.7%) = 177.1.
No doubt it’s better to be “happy” than “miserable.” As Arthur Okun anticipated over 50 years ago, the misery index provides politicians with a useful, easy-to-understand metric of well-being as viewed through the lens of official economics statistics. Why useful? Because politicians know that they can remain in office only if they garner the public’s support. And what generates public support? A healthy economy. Hence the importance of Hanke’s Annual Misery Index.