Data from historical and contemporary sources suggest that the poorest Americans—those in the bottom five percent—have higher incomes than roughly 95 percent of all the humans who have ever lived.
Article
Founding editor of The Independent Review Robert Higgs reminds us that “[i]ncome inequality is a statistical artifact. . . . The aggregate of the measure is arbitrary: why, for example, should inequality be measured for the entire U.S. population rather than for the population of the city or state in which one lives, the entire North American population (including Mexico), the entire Western Hemisphere population, or indeed the entire world population?” (2014).
He might have added “or indeed the entire world population throughout all of history.” In fact, measuring inequality this way may be very illuminating. Therefore, in the calculations below I take a preliminary stab at putting the incomes of today’s poor Americans into the broadest historical perspective.
Branko Milanovic (2010) provides data showing where people in different income ventiles (twentieths of the distribution) in several countries fall within the world’s income distribution. He finds that the income of the poorest 5 percent of Americans puts them at the 68th percentile of the world’s income distribution in 2010. Poor Americans are rather rich by the world’s standards today. However, they are far richer in comparison to all the people who have ever lived.
Virtually everyone in the premodern era lived at a small multiple of the subsistence level. Although subsistence cannot be precisely measured, Milanovic, Lindert, and Williamson (2007) estimate (following Angus Maddison 2001) that subsistence equals $400 per year in 1990 dollars, which equals about $855 per year today. Jeffrey Williamson (2009, 29–30) provides estimates of the ratio of the mean income to the subsistence income for a wide range of countries over a period of almost two thousand years. In the years before modern economic growth began, these ratios averaged about 3.1—falling below 2 in places like medieval Byzantium (AD 1000), Mughal India (1750), Qing China (1880), and colonial Kenya (1927), while slightly exceeding 2 in ancient Rome and exceeding 5 in a handful of places, including England (1759) and Holland (1732). Although a few places still have very low mean-income to subsistence-income ratios—both Tanzania and the Democratic Republic of Congo fell below 2 at the turn of the millennium—the ratio is now over 60 in places like Britain, France, Germany, Italy, Japan, and the United States (where it is over 80).
The U.S. Census’s Annual Social and Economic Supplement reports incomes of $0 and $800 for the bottom two percentiles in 2020 (DQYDJ 2021), which is obviously incorrect.[1] Income estimates are well below consumption levels for the American poor, as shown by data from the Bureau of Labor Statistics (2020). The BLS’s Consumer Expenditure Survey calculates that households with incomes in the bottom 10.4 percent (those earning less than $15,000 in 2020) earned 0.93% of total income in the United States while their consumption was 4.7% of the total. The gap is due to transfers from government and nongovernment sources (such as family members), unreported income in the formal and informal economy, and other factors. Consumption by the American poor is roughly five times (5.065) their income levels, although this ratio is probably an even higher multiple for the poorest of the poor. Accordingly, in comparing the bottom ventile (5 percent) of modern Americans to all the people who have ever lived, I use the consumption estimate, although one could make alternative adjustments. In 2020, average household incomes in the bottom ventile were $4,300 per year, so annual consumption was closer to $21,800. There is an average of 1.7 people in these households (called “consumer units” in the Consumer Expenditure Survey report), which means that the consumption per person averaged about $12,820.
Max Roser (n.d., using data from Van Zanden et al. 2014) estimates that among the world’s 1.09 billion people living in 1820 about 30.5 million had incomes above $12,800 per year (in today’s dollars), putting today’s Americans from the bottom ventile a bit above the 97th percentile (97.2) of the 1820 population. Angus Maddison (2001, 28) estimates that average income levels of AD 1 and AD 1000 were about one-third below those in 1800. If all the income estimates given by Roser are reduced by one-third, this implies that today’s Americans from the bottom twentieth would be a bit above the 98th percentile (98.1) among people living in the premodern period.
Kaneda and Haub (2020) estimate that about 94.4 billion of the 116.8 billion human beings who have ever lived were born by 1650, and 101.6 billion were born by 1850.
Using these numbers (see table 1), about 1.8 billion of the people born by 1650 were richer than those in the bottom five percent of Americans living today, and about 200 million of those born between 1650 and 1850 were richer than today’s bottom ventile.
There are currently about 7.9 billion people living, and Milanovic estimates that about 32 percent of today’s population have incomes above the bottom ventile of the United States, so about 2.53 billion people in the world have higher incomes than the poorest 5 percent of Americans. Similar calculations using Roser’s estimates put modern Americans of the bottom ventile at the 80th percentile worldwide in the middle of the twentieth century. There are about 7.3 billion people who were born after 1850 and who are no longer living. If modern Americans in the bottom ventile have incomes at the 80th percentile among them, this makes 1.46 billion of this final group who had incomes higher than the poorest 5 percent of today’s Americans.
There are surely some mismeasurements here, but I’ve tried to be conservative, for example, by ignoring bias in the consumer price index, which understates the value of today’s dollars versus the 1990 dollars used by Roser.[2] I have assumed that consumption equaled income before the advent of the welfare state in recent times.
Table 1 summarizes these results. Adding together the four groups (2.53 billion living + 1.46 billion born after 1850 but no longer living + 200 million from between 1650 and 1850 + 1.8 billion born before 1650), approximately 5.99 billion people have had incomes higher than the bottom 5 percent of Americans today.
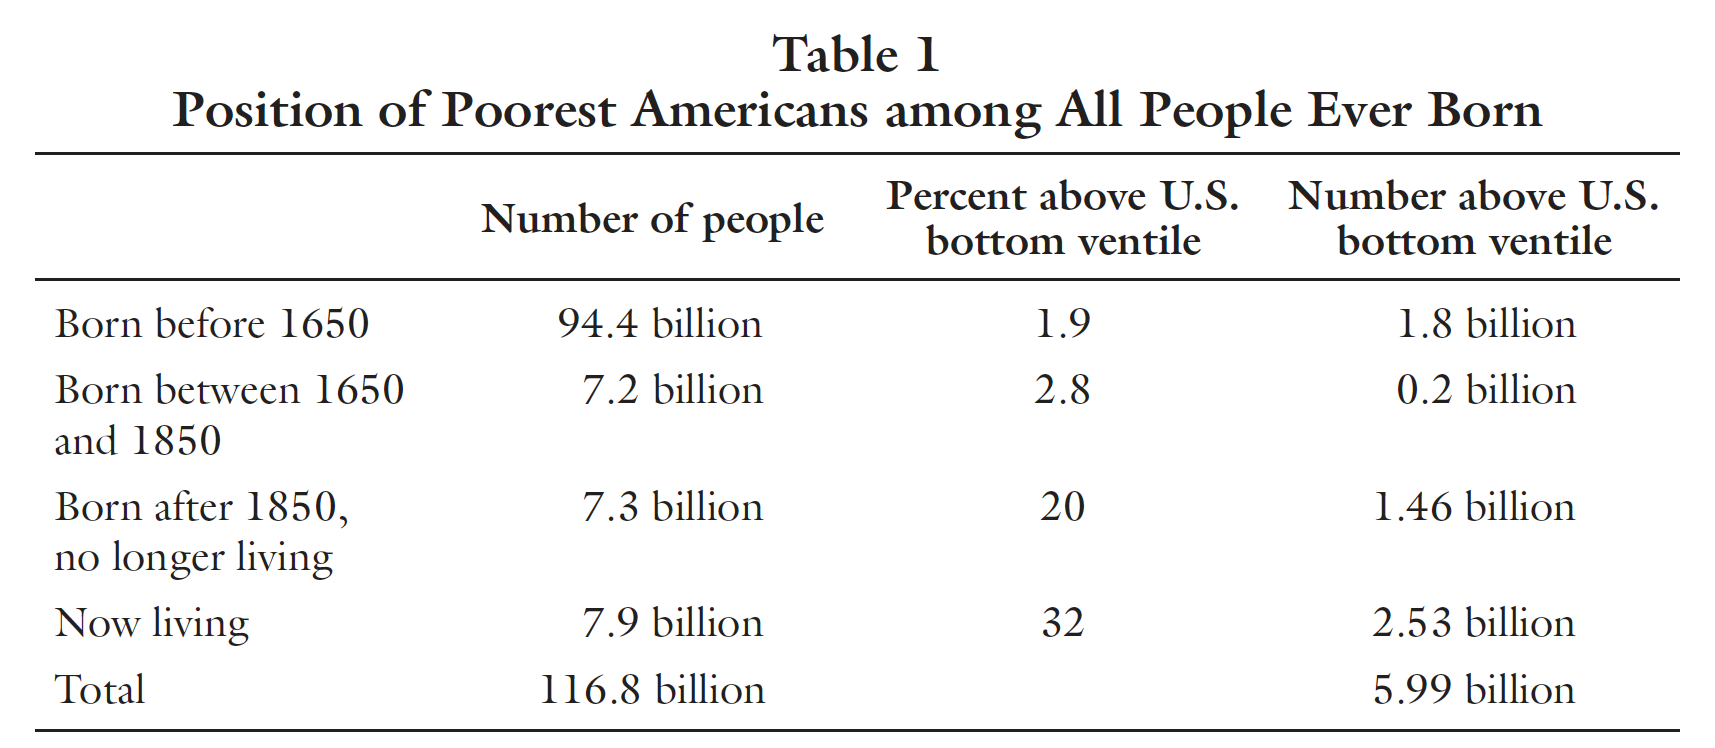
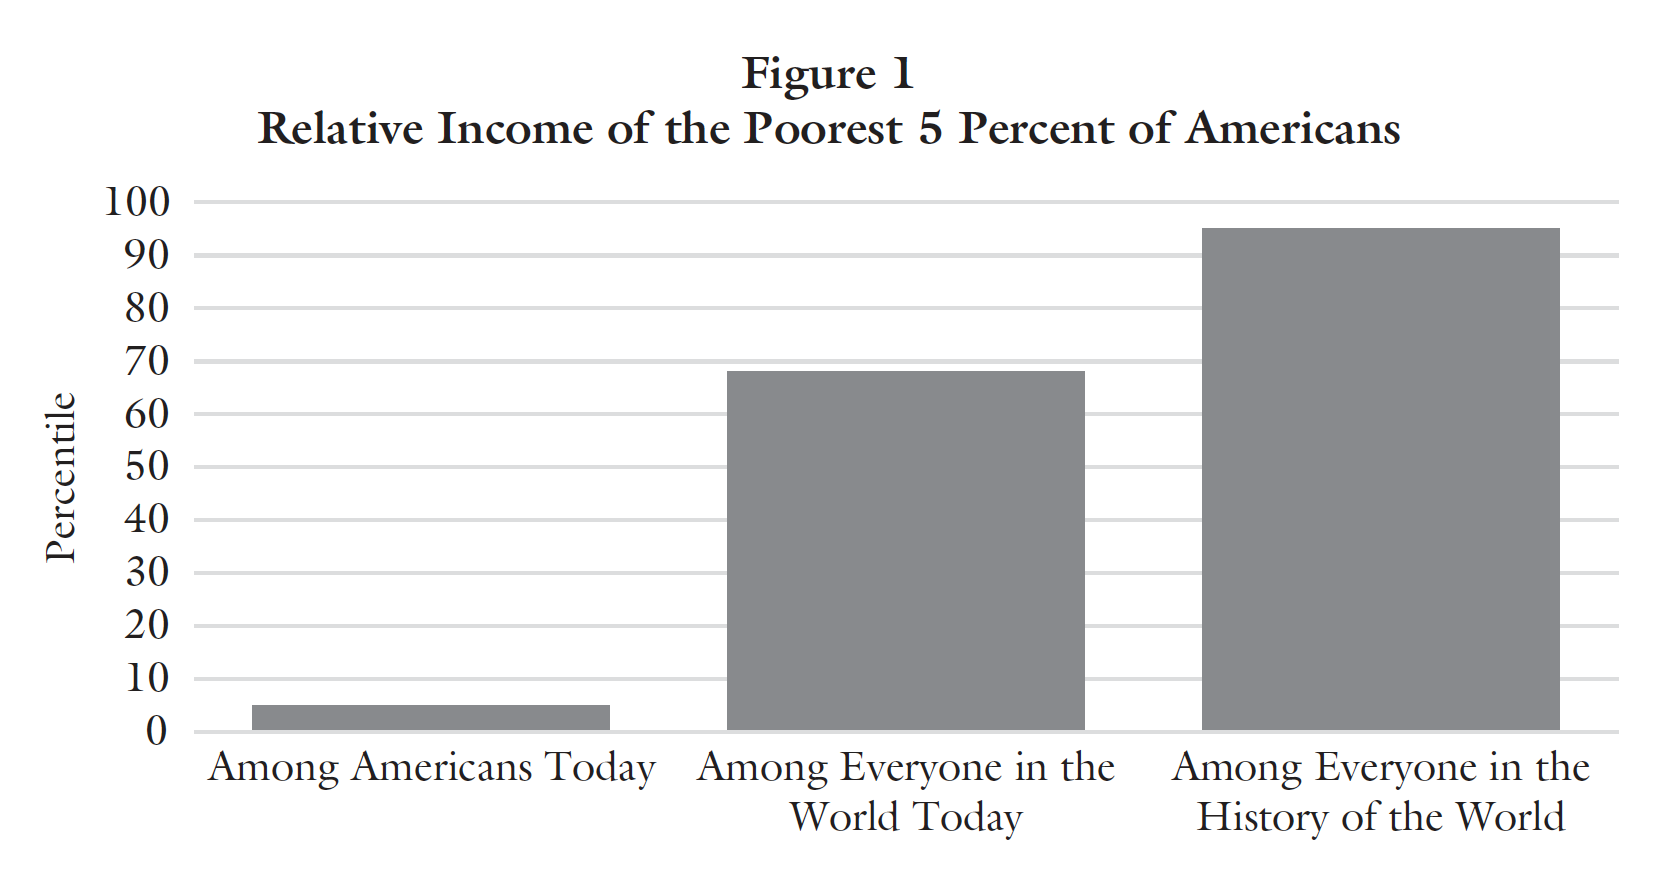
In other words, the poorest Americans have higher incomes than roughly 95 percent of all the humans who have ever lived.
This is a profound and little appreciated point: the poorest among us today are very well off economically by the standards of all of world history. They live lives that exceed even the aspirations of most people who have ever lived. Virtually everyone living in the United States today is an economic winner. Will anyone among us decry this inequality?
Notes
[1] Leeson, Hardy, and Suarez (2022) report that panhandlers in Washington, D.C. metro stations take in about $6.10 per hour.
[2] Roser’s figures are in 1990 dollars, which I’ve converted into 2020 dollars using the consumer price index, which estimates prices to be 2.14 times higher in 2020. This ignores the upward bias in the CPI due to substitution bias, quality change bias, new goods bias, and other biases. See, for example, Hausman 2003. Stripping out these biases would reduce the 2.14 ratio to about 1.67 by my back-of-theenvelope calculations.
References
Bureau of Labor Statistics. 2020. Table 1203: Income before Taxes: Shares of Annual Aggregate Expenditures and Sources of Income, Consumer Expenditure Survey, 2019.
DQYDJ. 2021. Average, Median, Top 1%, and all United States Household Income Percentiles in 2020.
Hausman, Jerry. 2003. Sources of Bias and Solutions to Bias in the Consumer Price Index. Journal of Economic Perspectives 17, no. 1: 23–44.
Higgs, Robert. 2014. Income Inequality Is a Statistical Artifact. The Beacon.
Kaneda, Toshiko, and Carl Haub. 2020. How Many People Have Ever Lived on Earth? Population Research Bureau.
Leeson, Peter T., R. August Hardy, and Paola A. Suarez. 2022. Hobo Economicus. Economic Journal, forthcoming.
Maddison, Angus. 2001. The World Economy: A Millennial Perspective. Paris: OECD.
Milanovic, Branko. 2010. The Haves and the Have Nots: A Brief and Idiosyncratic History of Global Inequality. New York: Basic Books.
Milanovic, Branko, Peter H. Lindert, and Jeffrey G. Williamson. 2007. Measuring Ancient Inequality. National Bureau of Economic Research Working Paper no. 13550.
Roser, Max. n.d. Our World in Data. World Income Distribution, 1820 to 2000.
Van Zanden, Jan Luiten, Joerg Baten, Marco Mira d’Ercole, Auke Rijpma, Conal Smith, and Marcel Timmer. 2014. How Was Life? Global Well-Being since 1820. Paris: OECD.
Williamson, Jeffrey G. 2009. History without Evidence: Latin American Inequality since 1491. National Bureau of Economic Research working paper 14766.
| Other Independent Review articles by Robert M. Whaples | ||
| Spring 2024 | A Vision of a Productive Free Society: Murray Rothbard’s For a New Liberty | |
| Spring 2024 | GOAT: Who Is the Greatest Economist of All Time and Why Does It Matter? | |
| Spring 2024 | Everyday Freedom: Designing the Framework for a Flourishing Society | |
| [View All (93)] | ||