The false “hockey stick” graph with which (in 2001) the UN climate panel claimed that current surface temperatures are “unprecedented” in a millennium is at odds with hundreds of scientific papers and with their own previous position. There is nothing unusual about today’s temperatures; the world was warmer in the Middle Ages. However, the "hockey stick” graph showing a rapid increase in 20th century CO2 concentration is genuine.
The Third Assessment Report (2001) of the UN-sponsored IPCC (Intergovernmental Panel on Climate Change) espouses a temperature history over the last thousand years that resembles a "hockey stick" (HS). The ‘shank’ is the smooth decline of temperature from 1000 to 1900AD, followed by an apparent sharp rise in the 20th century (forming the ‘blade’ of a hockey stick). IPCC-AR3 promoted this rise as definitive evidence of human influence on climate; emission of carbon dioxide was supposed to cause the 20th century warming. But this temperature history is fake; it is contradicted by much other evidence.
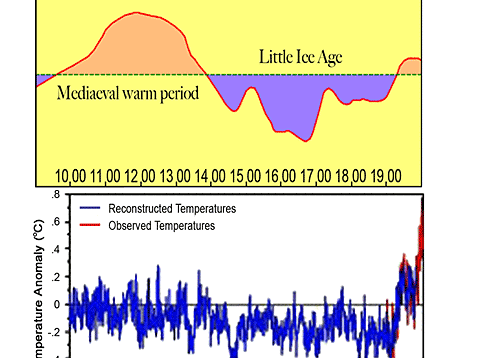
Top figure from IPCC-AR1 (1990) Bottom figure from IPCC-AR3 (2001)—does away with MWP and LIA
By “fake” I mean it is ‘not real.’ Please note that I do not use the term “faked.” I prefer to believe that Dr. Michael Mann, creator of the hockey stick, simply made several scientific errors when he derived this notorious graph of global surface temperature from his analysis of ‘proxy’ data (tree rings, corals, lake sediments, etc) of the past millennium. Canadian scientists Steven McIntyre and Ross McKitrick, as well as statistics expert Edward Wegman (of George Mason University in Virginia), demonstrated that Mann’s data and statistical methods are both faulty; yet he has not withdrawn his HS paper—though Nature was compelled to publish a belated and inadequate Corrigendum by Mann. Quietly, however, he has co-published temperature graphs that show a distinct Medieval Warm Period (MWP) 1000 years ago and a Little Ice Age (LIA), mostly around 1400-1800 AD.
1000 years of atmospheric CO2 and isotopic composition at the South Pole


Note the Little Ice Age and the Medieval Warm Period in the CO2 record (top graph). There is a slight peaking (maximum delta C-13) in the isotopic composition at the Little Ice Age (bottom graph), where presumably CO2 absorption by ocean would be enhanced.
Carbon dioxide data, mainly from sampling Antarctic ice cores over the last thousand years, also show a shape that (superficially) resembles a hockey stick; but this one is real. Yet there is no relation between the two graphs—or between temperature and carbon dioxide—as the following discussion will show. I fear that my comparison of the two graphs may cause great unhappiness for extreme alarmists as well as for extreme skeptics of global warming.
The Temperature Record
If one looks at the best temperature data over the last thousand years, they overwhelmingly support the existence of an oscillation on a time scale of 1000-1500 years—with a temperature maximum, the Medieval Warm Period (MWP), followed by the well documented Little Ice Age (LIA). These temperature swings are missing from Mann’s HS graph—which the IPCC unwisely featured, six times, in its 3rd Assessment Report of 2001. It is telling that IPCC’s 4th Report of 2007 and the forthcoming 5th Report no longer display the hockey stick–curve of Michael Mann.
A more detailed examination of thermometer data of the 20th century shows a major warming between 1910 and 1940, a slight cooling between 1940 and 1975, and a disputed temperature history of the last two decades of the century. It is interesting and worth noting that Mann’s HS graph stops just before 1980—even though the use of proxy data would indicate an absence of warming from 1980 to 2000. The leaked ‘Climategate’ e-mails between IPCC scientists, including Mann himself, suggest that “hiding the decline” in tree-ring temperature reconstructions, which should have been showing the same warming as the thermometers, was the reason why Mann stopped his analysis in 1980—and why his post-1980 proxy temperatures have never been revealed.
(An email from Professor Phil Jones at the University of East Anglia to Mann and his co-authors said: “I’ve just completed Mike’s [Mann] Nature trick [sic] of adding in the real temps to each series for the last 20 years (i.e. from 1981 onwards) and from 1961 for Keith’s [Briffa] to hide the decline.”)
The CO2 Record since 1000AD
Turning now to the CO2 data (assembled by Tom Quirk in Australia and kindly transmitted by Prof. Will Happer of Princeton Univ.): They show a remarkable hockey-stick shape—which, however, is real. The concentrations of atmospheric CO2 were preserved in air bubbles trapped in snow that turned into ice; the time record has been obtained from different samplings of Antarctic ice cores. It is supplemented and confirmed by a corresponding decrease in the isotope ratio of C-13/C-12. The sharp decrease of C-13 in the 20th century indicates that its source is most likely biogenic; fossil fuels from ancient plant material and biota would fit this specification.
1. A quick look at the CO2 curve shows a slight increase during the MWP and a slight decrease during the LIA. These excursions are readily interpreted as a (net) reduced uptake of CO2 when the ocean is warm and increased uptake when the ocean is cold. (We recall that roughly half of the CO2 emitted into the atmosphere during fossil-fuel burning and cement manufacture is absorbed into the ocean and that CO2 solubility depends inversely on ocean temperature—the well-known ‘champagne effect’.)
A more detailed interpretation of the CO2 curve leads to these additional conclusions:
2. Various skeptics have suggested that CO2 levels were higher during the 19th century than they are today. There is nothing wrong per se with these old measurements—though they were performed by old-fashioned chemical methods rather than current infrared techniques. It just means that the data obtained were contaminated and were not representative of global concentrations of free-atmosphere CO2. Antarctic is reasonably free of contamination.
3. It is often claimed by skeptics that the human contribution to atmospheric CO2 (from fossil-fuel burning) is tiny—less than a percent. The data clearly show that the contribution is 400 minus 280 parts per million (ppm)—roughly 30% of the current concentration.
4. Extreme skeptics have often claimed that George Callender, the British pioneer of the global-warming story during the early 20th century, was hiding some higher CO2 values from ice cores that approached present values. This does not seem to be the case.
5. From time to time, skeptics have claimed that the CO2 increase was mainly due to global warming, which caused the release of dissolved CO2 from the ocean surface into the atmosphere. (A recent adherent of this hypothesis is Prof. Murry Salby in Australia.) However, the evidence appears to go against such an inverted causal relation. While this process may have been true during the ice ages, the isotope evidence seems to indicate that the human contribution from fossil-fuel burning clearly dominates during the last 100 years.
6. Finally, note that the temperature ‘blade’ starts around 1910, while CO2 starts its sharp upward climb around 1780AD.
Conclusion
Upon reflection on these temperature and CO2 data of the last thousand years, I conclude that the evidence presented here will cause unhappiness for both extreme alarmists and extreme skeptics. Maybe that’s a good thing.
However, it still leaves open the question of climate sensitivity (CS), i.e., the actual influence of CO2 on global temperature. CS has been steadily decreasing, from 3°C (for CO2 doubling) in the initial IPCC report. I believe confidently that the real CS values may be much lower—although not quite zero. I base it on what Dr. Rajendra Pachauri, chairman of the IPCC, has delicately called the 17-year “pause” in global warming of the near-surface, and on the near-absence of tropical atmospheric warming, as seen by weather satellites since 1978.
The scientific puzzle is why IPCC climate models predict large values for CS while the observations show only small ones.