Independent Institute Sr. Vice President Mary L. G. Theroux testified in front of the California Senate Subcommittee on Health and Human Services, at the request of state Senator Jeff Stone. Witnesses spoke to the committee about California’s Maximum Family Grant rule for families on welfare. The rule caps grants and does not increase grant money to mothers on welfare when they have more children. Mary testified about the causes of poverty and of other options for poor families. She introduced ideas for helping the poor through private resources and organizations, instead of government agencies where families often find themselves in a circle of poverty.
-------
Thank you for including me today, and I trust we can agree that we’re all here today to try to discover ways of decreasing the number of children living in poverty.
The causes of childhood poverty are many and varied, and I will focus my comments on the fact that the number one correlation for childhood poverty is living in a household headed by a single mother.
The repeal or continuance of the Maximum Family Grant is way too late in the cycle of poverty to have a lasting impact, and in order to have a meaningful impact, we need to ask some creative questions.
Policies such as MFG came out of thinking of the problem as one of: “People are poor because they have children they cannot afford. Surely if the poor understood that having children they couldn’t afford made them worse off, they would choose not to.” This way of thinking led to the family cap rule, as well as thinking that simply extending contraceptive services and availability of abortion on demand would “solve” “the problem.”
But none of these has solved the problem: the rate of children born into poverty has continued to rise, even in the face of welfare caps, universal sex education and abortion rates that some have termed genocidal.
Loretta Ross, co-founder of SisterSong Women of Color Reproductive Justice Collective, has observed, “...if people are not convinced that they have realistic economic and educational opportunities, you could put a clinic in a girl’s bedroom and she would still think early motherhood is a better choice.”
This flips the question on its head: is it a matter not that people are poor because they choose to have children they cannot afford—or is it that they choose to have children they cannot afford because they are poor?
And, increasingly, this is the conclusion being drawn:
A current Brookings Institution report shows that single women of child bearing age who live below the poverty level are almost five times more likely to have a child than affluent single women, and concludes, “women with higher incomes are much more successful at ensuring that sex does not lead to an accidental baby. This almost certainly reflects their brighter economic and labor market prospects: simply put, they have more to lose from an unintended birth. Improving the economic and educational prospects of poorer women is therefore an important part of any strategy to reduce unintended birth rates.”
A 2011 National Bureau of Economic Research working paper similarly concludes, “Our reading of these seminal and influential works is that they find common ground in the notion that growing up in an environment where there is little chance of social and economic advancement leads young women to bear children outside of marriage. These women perceive that they have so little chance for success in life ...[that t]hey see no reason to postpone having a child and may even benefit from having one, regardless of marital status.”
Today it is far, far harder for a poor young woman to have access to a quality education, a good entry-level job or to be able to start her own enterprise than for her to set up a new household in welfare.
California requires licenses for 62 low- and moderate-income occupations such as florist, makeup artist, massage therapist, preschool teacher, shampooer, and barber, charging an average license fee of $300, and imposing an average education-and-experience requirement of 549 days. This is the third-highest in the U.S., and to a poorer or less-educated person can be insurmountable roadblocks.
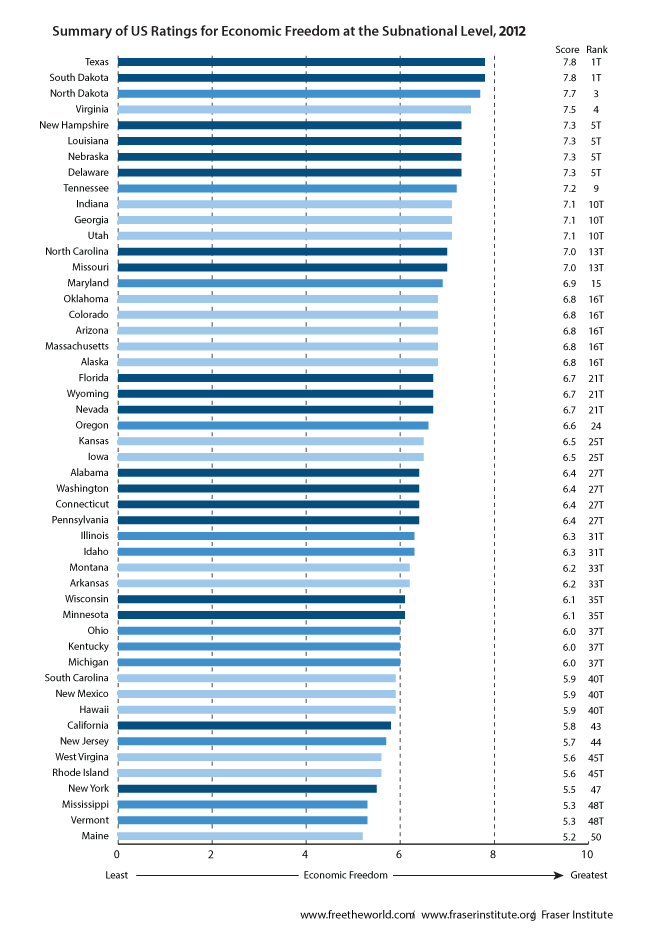
Further, California is categorized “Least free” in a ranking of economic freedom among the fifty states of the U.S.
Globally, poverty rates have plummeted dramatically in nations across every region that have liberalized their economic freedoms, with inequality declining in sync with a decline in poverty.
Meanwhile, decades after “A Nation at Risk” identified our failed public education system as a primary driver of the cycle of poverty, and countless follow-on studies, documentaries, and education reform initiatives, poor parents are still offered little-to-no say in where their children are enrolled, regardless of outcomes.
Increases in public school spending go primarily to increased administrative costs and correlate with declining educational outcomes. A higher percent of students test proficient in reading and math in states that spend the least per pupil in instruction—Arizona and Oklahoma—states that also have parental-choice scholarship programs.
For 16 years at the Independent Institute we have operated a private voucher program providing economically disadvantaged families in the San Francisco East Bay freedom to choose a private education for their children. This area alone has over 300 private schools, producing superior educational reports for the very demographics that are failing in public schools.
Your tax-paying constituents will not thank you for expanding welfare benefits. It’s not that they want to see children in poverty, and in fact it’s the single dollar bills put into Salvation Army kettles that fuel the most-effective private programs helping families up and out of poverty.
Your taxpaying constituents work hard, make hard choices, and do without so that their children can have a better life. They want others to have a path such as their parents followed, and that they are on. And that’s the point. The pattern of poverty used to be primarily a one-generation phenomenon: a first generation needed some help with subsequent generations moving onto and up the economic ladder. Today, it’s multigenerational, with the children of parents helped 20 years ago needing as much or more help today.
People in poverty having children they cannot afford puzzle us all, but we need to understand that individuals make choices based on the options they see. When they see no educational or economic opportunities, having a baby can indeed look like the best option available—“If I don’t have a baby, what else am I going to do?”
And Section 11450.04 hasn’t produced the expected result because if you’re already in poverty and receiving welfare, not receiving additional welfare for an additional child isn’t motivation enough to result in a different choice. It doesn’t make more than a marginal difference: you’re already poor, what’s a little more or less poor?
The former National Commander of the Salvation Army used to rally his followers with the cry: “We’re not here to make poverty comfortable”—we’re here to help people out of poverty. We don’t want the best option available for those we purport to want to help to be establishing a household in welfare.
That this is reportedly the best option for too many today is tragic. It’s locking entire families into poverty without hope. Your constituents want to see policies that help the poor get out of poverty, and have good lives just as they are working hard to establish for their own families.
This is the stated mission of Mr. Mecca’s agency: “to promote a human services system that encourages self-sufficiency of families and communities.”
And I believe that this is the dream of us all.
If the California State Senate truly wants to see fewer children in poverty, the policy implications are clear: allowing true school choice, including providing parents and teachers the option of establishing or taking over and running their own schools; and eliminating economic barriers, including burdensome regulations, taxation, licensing and zoning restrictions that protect established economic interests and are anti-job and anti-small enterprise.
Supporting Data
For Testimony by Mary L. G. Theroux, Senior Vice President
The Independent Institute
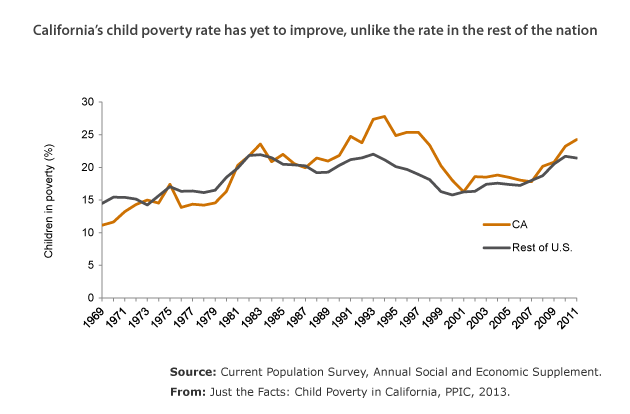
California’s child poverty peaked in 1994—the year the Maximum Family Cap was passed—at 28%. It reached a two-decade low of about 16% in 2001. In 2013, it was 23%.
From 2007 to 2013 (the most recent year for which data are available), the average nationwide child poverty rate increased from 18% to 22% percent. Illinois and Nebraska discontinued their family cap rules in 2007. In 2013, Illinois’ child poverty rate had increased to 21% from 17% in 2007. Nebraska’s was at 18% in 2013, up from 15% in 2007. In October 2002, Maryland allowed counties to opt out of its “child-specific benefit,” and all have done so. Maryland’s child poverty rate remained virtually flat at 10% from 2003 to 2007, increasing to 14% in 2013.
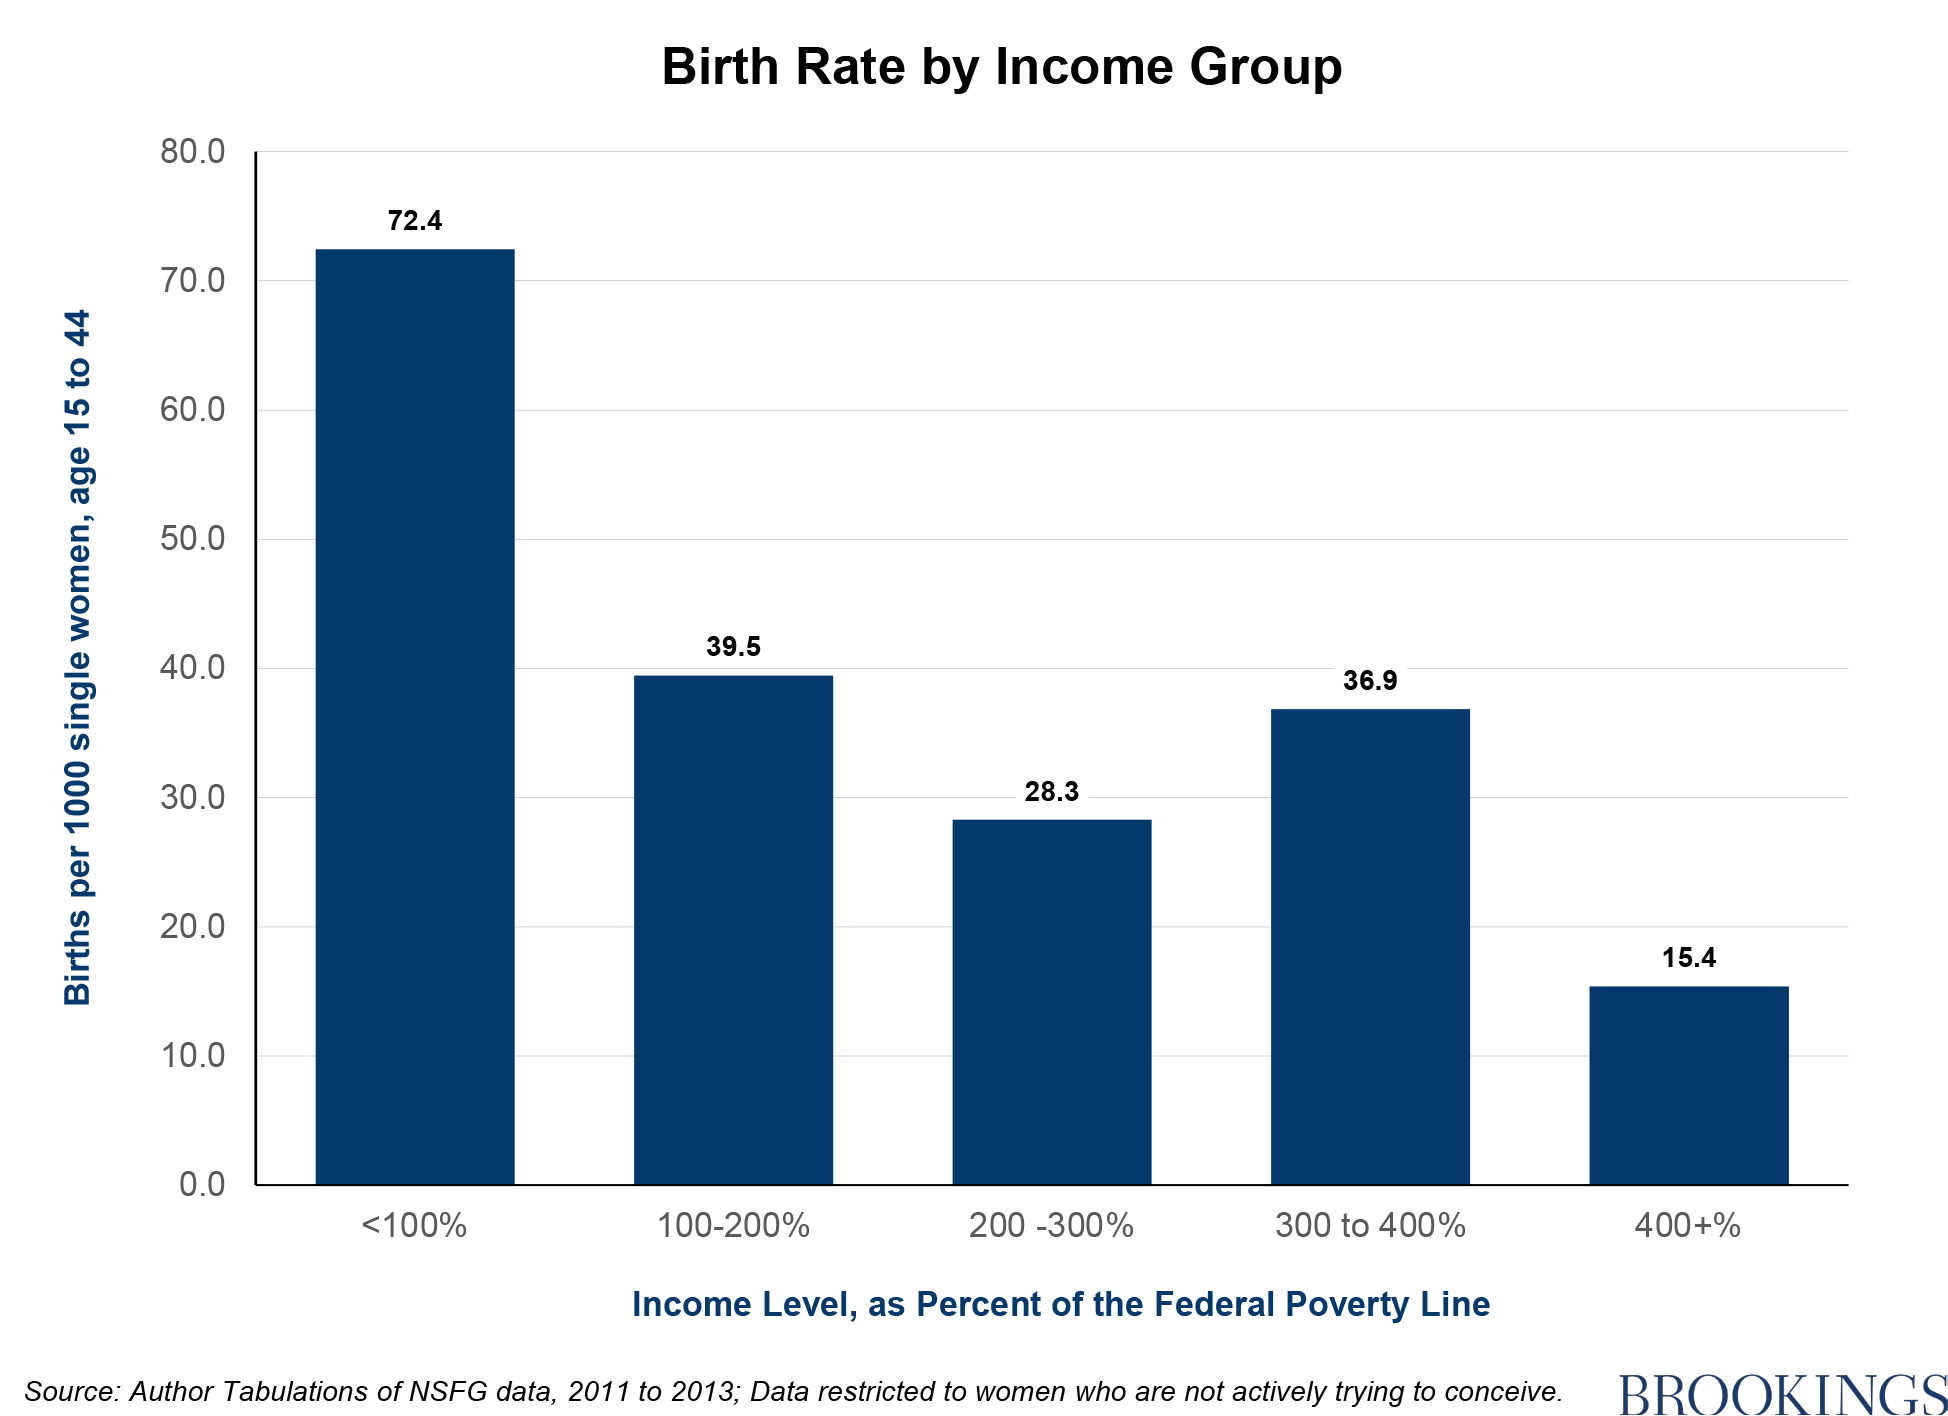
The birth rate for poor, single women of reproductive age (excluding those who are trying to have children) is almost five times higher than the birth rate for the comparable group of women with incomes above four times the federal poverty line (FPL):
IV. Conclusion
Control of fertility varies widely between income groups. Most unmarried women are sexually active, regardless of income. But women with higher incomes are much more successful at ensuring that sex does not lead to an accidental baby. This almost certainly reflects their brighter economic and labor market prospects: simply put, they have more to lose from an unintended birth. Improving the economic and educational prospects of poorer women is therefore an important part of any strategy to reduce unintended birth rates.
Source: “Sex, contraception, or abortion?
Explaining class gaps in unintended childbearing”
The Brooking Institution
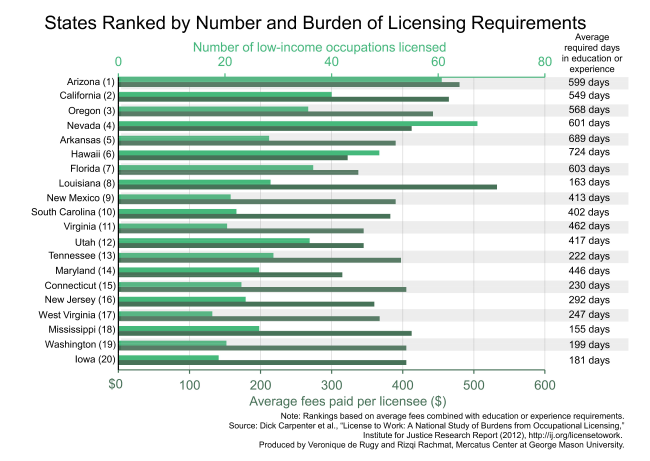
“California licenses 62 of the 102 occupations studied—the 3rd highest.
“California charges its aspiring workers an average fee of $300 in the occupations it licenses, and imposes an average education-and-experience requirement of 549 days. Would-be workers must also pass one exam in the licensed occupations. The average state requires $203 in fees and 307 days in education and experience.
“A year and a half of education/training, $300 in license fees, and one passed test might not sound like a heavy burden in California, but to a poorer or less-educated person these can be roadblocks to entry into their preferred field. Time spent in education is typically time spent not earning income, so the opportunity cost of the education requirements alone, in terms of foregone income, can be prohibitively expensive.
“The report also found that California:
-
Is one of only a few states that license tree trimmers, landscape workers, dietetic technicians, psychiatric aides, still machine setters, funeral attendants, dental assistants, and farm labor contractors.
-
Requires tree trimmers and landscape contractors to hold a contractor’s license, requiring four years of training—the most burdensome requirements in the nation for those jobs.
-
Imposes four years of education-and-experience requirements with fees and examinations on would-be construction workers. Many states either require no education or experience or do not license this occupation at all.
-
Is the only state besides Florida to require farm labor contractors to pass a test.
- Has the longest education-and-training requirement—a full two years—for teachers’ assistants.”
Source: “Occupational Licensing Is Unjust, Unneeded, and Increases Income Inequality”
Lawrence McQuillan, Ph.D., The Independent Institute
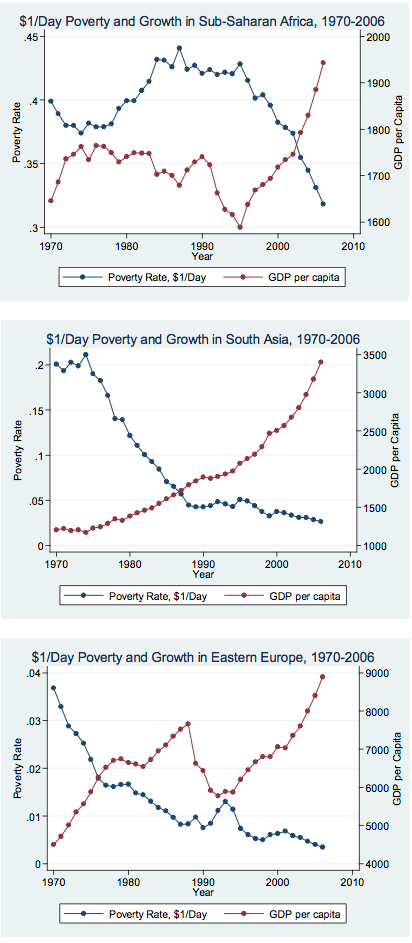
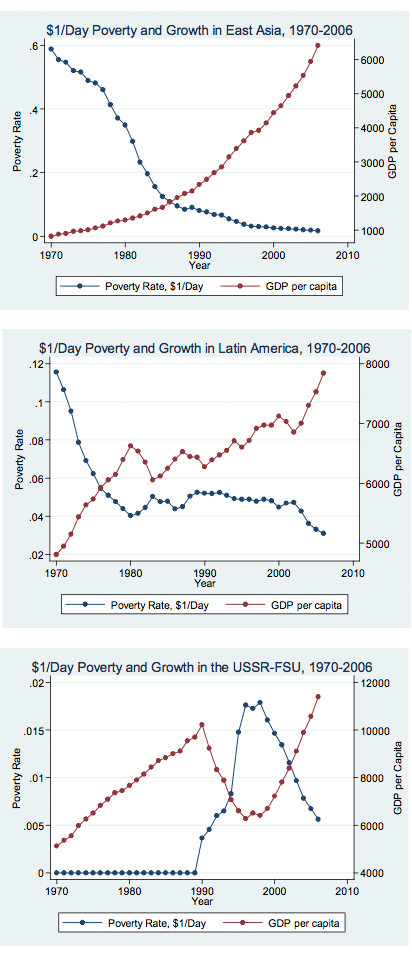
Economic and trade liberalization has produced GDP growth.
“It is immediately visible that the series are almost perfect mirror images of each other: the poverty rate falls when per capita GDP rises and vice versa.... In particular, we see no examples of poverty reduction without growth (or sustained rises with poverty accompanying growth) on a regional scale. [emphasis added]”
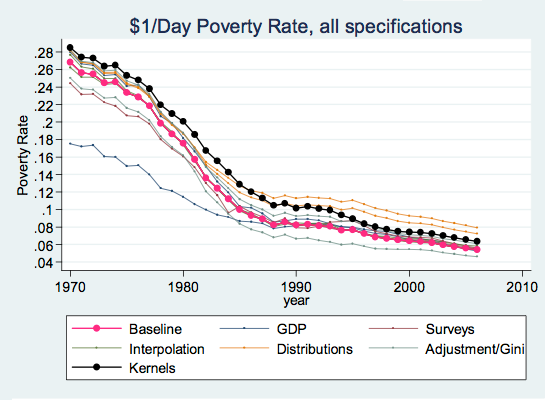
Source: National Bureau of Economic Research Working Paper: “Parametric Estimations of the World Distribution of Income,”