The concept of Climate Sensitivity (CS) is a useful way to describe the effects of carbon dioxide on the climate. CS can be derived either from climate models or empirically—with the hope that the two results are concordant. Let’s look at models first.
Some 30 years ago, the National Academy of Sciences set up a group under MIT meteorologist Jules Charney to study this problem. Their report arrived at a CS value of 1.5 to 4.5 degC of global climate warming for a doubling of atmospheric carbon dioxide. One immediately notices the huge uncertainty, a factor of 3. Yet the climate forcing of CO2 is known much more precisely.
The explanation for this wide uncertainty range of CS lies in our imperfect knowledge of (1) feedback from clouds and from water vapor (WV is the most important atmospheric greenhouse gas) and (2) the radiative effects of aerosols in changing the albedo of the Earth atmosphere and thereby the amount of sunlight reaching the surface.
This range of 1.5—4.5 degC has become canonical by now. In fact, the most recent report of the IPCC [2013] gives the same range for CS—even after 25 years and spending billions of dollars on the development of climate models. As my colleague Kenneth Haapala points out, it’s been a poor return on investment.
Of course, the models have become much more sophisticated and complex. And the number of models has increased exponentially. Every self-respecting nation nowadays wants to have its own climate model; the United States already has five major ones and is considering financing yet another. But fundamentally, not much has changed. The extent of the positive feedback from water vapor, which implicitly amplifies the forcing of CO2 in all of the models, is still uncertain and so are the detailed influences of cloudiness and of various kinds of aerosols.
It is well to point out that we refer here to the so-called “equilibrium climate sensitivity,” which is reached after the climate system has had time to adjust to the higher CO2 levels. One should also point out that CS refers to a doubling of pre-industrial CO2—assuming a value of 280ppm. Also, CO2 forcing increases only as the logarithm of CO2 concentration, although this fact is seldom explicitly recognized.
Of course, the proper way to determine Climate Sensitivity (CS) is empirically—by using the climate data. But at this point many problems arise. First, selection of the proper time interval. It is generally recognized that there has been little if any warming in the last 18 years; so presumably, the climate sensitivity of the 21st century is effectively zero. Analysts of CS have therefore concentrated their efforts on the “reported” warming of the Earth’s surface between 1975 and 2000 (which may not even be real). These analysts have published a dozen or more “best numbers”—generally near 1.5 degC, the lower end of the CS range of the models.
A dispute among skeptics
All these analyses are based on the warming of the last part of the 20th century—from about 1978 to 2000—the so called “satellite era.” But there is no reason at all to define climate sensitivity in terms of surface temperature. Since the best global data we have come from weather satellites, it makes sense to use their atmospheric temperatures as the base for determining CS.
But the satellite data do not seem to show a warming trend—although there is a dispute on this point even among so-called “climate skeptics.” One can illustrate this dispute by looking at the graph below. If one draws a best straight line through all of the satellite data from 1978 to 2013, one can discern a small positive (warming) trend. But is this really the best way to describe the situation? Another way is to draw a line of zero slope up to 1997, note a one-year spike in 1998 (caused by a Super El Nino), and then document a sudden increase (“jump”) around 2001 and zero trend thereafter. Clearly, if the trend is zero between 1978 and 1997, then the climate sensitivity will be close to zero also.
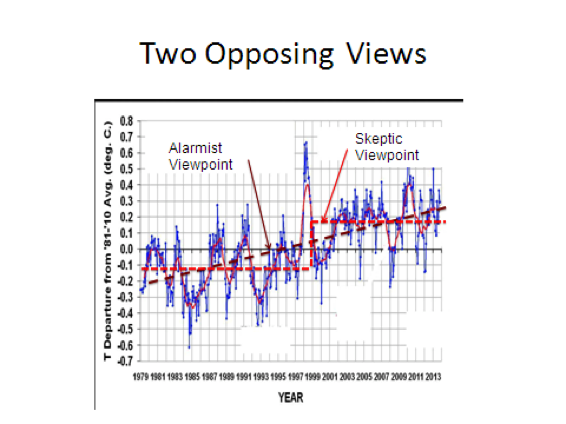
Graph by Don Rapp, based on UAH-MSU data
I happen to disagree with both methods described in the graph. I note that after the 1998 spike, temperature returns to its pre-1998 lower value—between 1999 and 2000. I would therefore put the “jump”, the step-like increase, at around 2001-2002. We now have zero slopes both before 2000 and after 2002—and therefore corresponding values of CS which are close to zero.
The moral of the story is that the best empirical data we have show very little influence on global temperatures from rising CO2 levels.
Two scientific puzzles
Now there are still two puzzles:
First, why is there so little post-2002 warming from carbon dioxide—which after all is a greenhouse gas and is increasing in the atmosphere? The best answer I can think of is a negative feedback from water vapor—not a positive feedback—which counteracts the forcing produced by CO2. Similarly, one could argue for a negative feedback from increased cloudiness. However, it is necessary to demonstrate both of these feedback possibilities empirically by examining the appropriate data.
An additional possibility may exist, namely that the forcing increase of CO2 is close to zero at just about the value that exists in the atmosphere today. Again this needs to be demonstrated by examining the appropriate data.
Finally, another puzzle: If indeed the climate sensitivity is close to zero from 1978-to 2000, and again from 2002 to present, why do surface thermometers indicate a warming trend only in the first interval, but not in the second interval? What accounts for the reported warming during the period 1978-2000?
All of this requires a good deal of work to investigate various plausible hypotheses, which we’ll leave for another time. Meanwhile, to quote Nobel laureate MIT professor Robert Solow: “Maybe that’s why God created graduate students.”
I should note that I am somewhat out of step here with my fellow skeptics. Few of them would agree with me that the climate sensitivity (CS) is indeed close to zero. I will have to publish the analyses to prove my point and try to convince them. Of course, nothing, no set of facts, will ever convince the confirmed climate alarmists.