Since 2008, the Chicago-based, libertarian-leaning Heartland Institute has organized nine ICCCs (International Conferences on Climate Change). Norman Rogers (American Thinker, Aug 9, 2014) has given a general overview of ICCC-9 (at Las Vegas), which attracted an audience of well over 600 and featured speakers from 12 nations. Here I present a more detailed and personalized account of the two main science issues that appear to be of general concern. The first has to do with future temperatures and the second has to do with future sea level rise (SLR).
When it comes to global average surface temperature (GAST), the concern seems to be to remain below 2 deg. It should be recognized that this limit is entirely arbitrary. There is no established scientific basis for assigning special significance to it; it just happens to be the “Goldilocks” number. Here is what I mean: If one were to choose 0.5 deg, people will say “we’ve already seen that and nothing has happened.” However, if we were to choose 5 deg, people will say, “we’ll never see that much warming—hence of no significance.” That is why 2 deg may have become the alarmists’ choice.
The real question relates to Climate Sensitivity (CS)—defined as the temperature rise associated with a doubling of CO2. (The definition varies slightly between different authors.)
IPCC initially claimed a very large CS. But after the first Assessment report of 1990, CS dropped from 4.5 to about 2.5 deg. From then on, IPCC only considered the last part of the 20th century and no longer claimed the earlier warming (1910-40) to be manmade [see Slide-1].
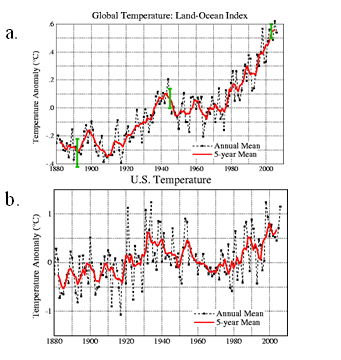
S-1: (a) GAST (Global Ave Surface Temp) (b) Note that max US temp occurred in 1930s Source: GISS
In my view, CS may actually be close to zero. This means CO2 has very little influence on climate change—probably because of negative feedback. There is still debate, however, about what kind of negative feedback to expect. Should it come from water vapor or from clouds?
1. IPCC’s ever-changing, non-existing evidence for AGW
First, I want to critique IPCC reports #1 (1990) to #5 (2013). As a so-called ‘expert reviewer’ I have enjoyed a unique observation platform for successive IPCC drafts. It is rather amusing that the Summaries talk about increasing certainty for AGW (anthropogenic global warming)—while at the same time modeled temperatures increasingly diverge from those actually observed [S-2].
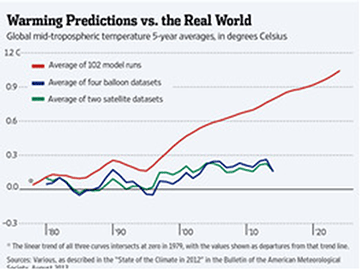
S-2: IPCC confidence in AGW: 50%[1996]; >66%[2001]; >90%[2007]; >95%[2013] --------------------------------
First, we note that each report “Summary” is produced by a political consensus, not like the underlying scientific report. (Doubting readers can visit the web site.) As Rogers points out, the U.N. mandate is: “understanding the scientific basis of risk of human-induced climate change...” There is no mandate to consider any other causations, such as natural ones related to solar change and ocean circulation cycles—just presumptive human causes, such as fossil fuels. The IPCC sees a human climate-fingerprint everywhere because that is what they are looking for.
Specifically, IPCC-AR1 indicates a climate sensitivity of 4.5 deg, by considering both reported temperature increases (1910-1940 and 1975-1997) to be anthropogenic [S 1]. After severe criticism of this ’evidence’, IPCC dropped the climate sensitivity to 2.5 deg by considering only the most recent decades of reported global warming as anthropogenic. The earlier warming (1910-1940) is now considered to be caused by natural forcing.
Having given up on anthropogenic forcing for 1910-40, IPCC then considered different types of evidence to support AGW for the interval 1975-2000. In their 1996 report, AR2, Ben Santer “manufactured” the so-called Hotspot (HS), a calculated maximum warming of the upper troposphere [S-3], and claimed it as a fingerprint of AGW. This is incorrect on two counts; the HS is not a fingerprint of AGW at all—and it does not even exist. It was manufactured from the (balloon-radiosonde) temperature record, where a segment shows a short-term increase while there has been no long-term increase [S-4] as clearly seen from the actual data.
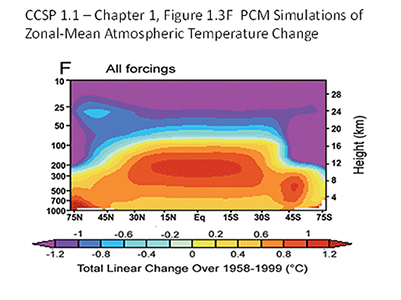
S-3: Modeled HotSpot in tropical troposphere
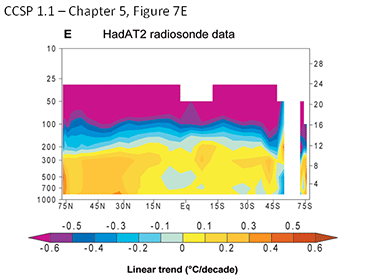
S-4: No observed HotSpot
--------------------------------------------
It is worth noting that CCSP 1.1 [2006], the climate change science report of the US government, with Santer as a lead author, shows a HS in the models [S-3] but no observed HS [S-4]. The disparity between models and observations is striking. It nicely illustrates the major source of scientific disagreement—between those who rely on model calculations vs those who rely on observations.
In IPCC-AR3 [2001], they no longer use the HS but have gone to Mike Mann’s notorious Hockeystick—claiming that in the past 1000 years only the 20th century showed unusual warming [S-5].
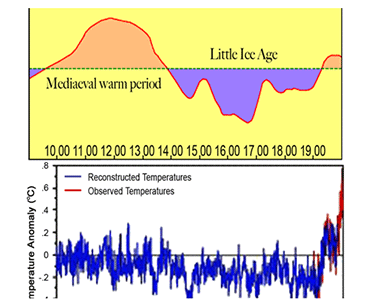
S-5: Top; from IPCC-AR1. Bottom: AR3; proxy analysis (blue) stops suddenly in 1979 -----------------------------
A close examination of the proxy data used in the Hockeystick shows that the warming was not unusual at all and probably less than existed 1000 years ago—and that major warming comes only by adding the (reported) temperature curve from instruments [S-5]. Note also that Mann suppresses his post-1979 proxy data, which probably showed no such warming.
Because of many valid criticisms, the Hockeystick argument has now been dropped by IPCC and is no longer used to claim AGW. Instead both AR4 [2007] and AR5 [2013], in their chapters on ‘Attribution,’ rely on very peculiar circular argument for supporting AGW.
Both reports ‘curve-fit’ a calculated curve to the reported temp data of the second half of the 20th century. [This can always be done by choosing a suitable value of climate sensitivity, and an assumed aerosol forcing]. After having obtained a reasonable fit, they then remove the greenhouse- gas forcing, and of course, obtain an unforced model curve that no longer shows any temp increase (see S-6). But they then claim that this gap with respect to the data is sure evidence for AGW. This claim defies logic and makes absolutely no sense. They simply modified the calculated curve and then claimed that the resultant gap proves anthropogenic warming.
S-6: Unforced model (red) Source: IPCC-AR5 Chap 10 (‘Attribution’) ----------------------------------
2. SLR (sea level rise) shows no acceleration in 20th century
It is generally accepted that sea level has risen by about 400 feet (120 meters) since the depth of the most recent ice age, about 18,000 years ago. The best values come from coral data in the Caribbean.
The IPCC in its five reports has attempted to estimate SLR expected by the year 2100. As seen in S-7, these estimates have been decreasing, with the lowest values obtained in the draft of AR4 [2007]. However, the final version of AR4 shows slightly larger estimates.
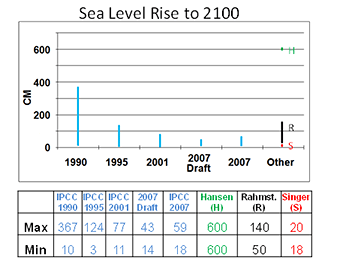
S-7: SLR estimates by five IPCC reports. AR5 [2013] values (in black) closely match Rahmstorf’s --------------------------------------
AR4 [2007] still produces reasonable values for SLR. But by the time AR5 came around, we can see a rough doubling of the lowest and highest estimates – as shown (in black) in S-7.
We now look at the summary result (from chapter 13 of AR5) in some detail in S-8 – and pose the crucial question: Is there reliable evidence for acceleration in SLR associated with temp rise and CO2 increase during the 20th century? As we shall see, the answer is NO.
S-8: SLR. Source: IPCC-AR5, Chap 13 (SLR)
---------------------------------
The first question one might ask of S-8: why does SLR suddenly accelerate in 1880, going from zero to about 7 inches per century (18cm/cy)? The answer may be that IPCC data does not agree with other data that show no such acceleration.
Next, why is there an acceleration shown at 1993 in S-8? The answer is that IPCC introduced a new observational method, based on Radar from satellites. But as argued by Willie Soon, the new data set is problematic and disagrees with the traditional data from tidal gauges. The latter do not show any acceleration during recent centuries. On the contrary, some tidal-gauge analyses show a deceleration around 1960 [S-9]. The cause is not known but its reality has not been questioned. It certainly disagrees with the more rapid rise reported from satellites.
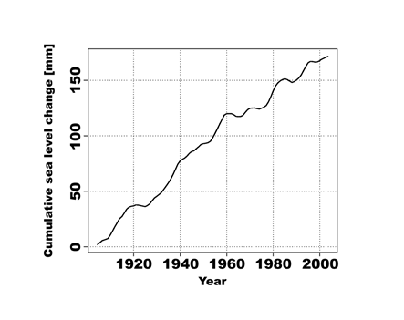
S-9: Analysis of tidal-gauge data, showing deceleration, independent of ocean temp and CO2. Source: Holgate
----------------------
My best estimate for the year 2100 is a further SL rise of about 15cm [see S-7] and continued rise thereafter of about the same value (18cm/cy)—independent of any short-term temp fluctuations. In my opinion, there is nothing we can do about this natural rise, which will continue until the next Ice Age—when sea level will drop as ice accumulates in the Polar Regions and on glaciers. Meanwhile, we should follow the Dutch example: relax and build dikes.