
Now we tackle, using newly available data, what may have caused the fictitious temperature trend in the latter decades of the 20th century.
We first look at ocean data. There was a great shift, after 1980, in the way Sea Surface Temperatures (SSTs) were measured (see Goretzki and Kennedy et al. JGR 2011, Fig. 1), “Sources of SST data.” Note the drastic changes between 1980 and 2000 as global floating drifter buoys geographic changes increasingly replaced opportunities for sampling SST with buckets.
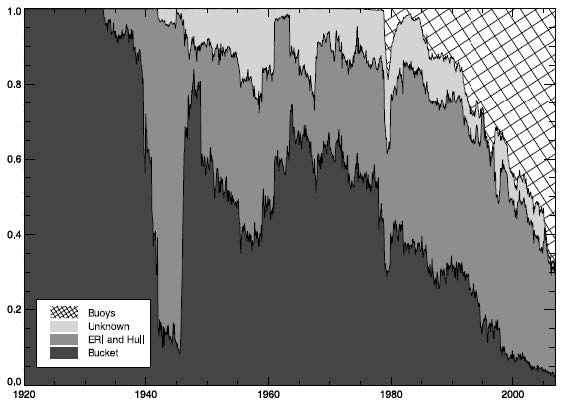
Data taken from floating drifter buoys increased from zero to 60% between 1980 and 2000. But such buoys are heated directly by the sun, with the unheated engine inlet water in lower ocean layers. This combination leads to a spurious rise in SST when the data are mixed together.
In merging them, we must note that buoy data are global, while bucket and inlet temperatures are (perforce) confined to (mostly commercial) shipping routes. Nor do we know the ocean depths that buckets sample; inlet depths depend on ship type and degree of loading.
Disentangling this mess requires data details that are not available. About all we might demonstrate is the possibility of a distinct diurnal variation in the buoy temperatures.
The land data have problems of their own. During these same decades, quite independently, by coincidence, there was a severe reduction in “superfluous” (mostly) rural stations—unless they were located at airports. As seen from Fig. 2, the number of stations decreased drastically in the 1990s, but the fraction of airport stations increased sharply...
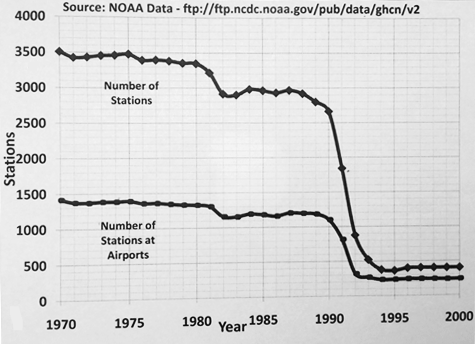
...from ~35% to ~80%, in the fraction of “airport” weather stations, producing a spurious temperature increase from all the construction of runways and buildings. These are hard to calculate in detail. About all we can claim is a general increase in air traffic, about 5% per year worldwide (Fig. 19, “HTCS-1”).
We have, however, MSU data for the lower atmosphere over both ocean and land; they show little difference, so we can assume that both land data and ocean data contribute about equally to the fictitious surface trend reported for 1978 to 1997. The BEST (Berkeley Earth System Temperatures) data confirm our supposition.
The absence of a warming trend removes all of the IPCC’s evidence for AGW (anthropogenic global warming). Both IPCC-AR4 (2007) and IPCC-AR5 (2013), and perhaps also AR-6, rely on the spurious 1978–1997 warming trend to demonstrate AGW (see chapters on “Attribution” in their respective final reports).
Obviously, if there is no warming trend, these demonstrations fail—and so do all their proofs for AGW.