
We Austrian economists frequently cross swords with our Keynesian foes on all manner of economic analysis and government policy recommendations. Yet the standard Austrian analysis of the business cycle is also sharply at odds with that of the “Market Monetarists,” a new school of thought coming out of the Chicago school tradition and now gaining traction at places like the Mercatus Center. In particular, prominent Market Monetarists have challenged the Austrian narrative of the housing bubble, arguing that the claims of “malinvestment” and the need for reallocation of resources do not fit the data. Yet as we’ll see, it’s the Market Monetarists who are defying common sense with their alternate version of history.
Scott Sumner’s Critique of “Malinvestment”
In the standard Austrian view, when the banking system (nowadays led by a central bank) injects credit and pushes interest rates artificially low, it sets off an unsustainable boom. However, the distortion is not merely monetary: During the boom, malinvestments occur. Because the capital structure of the economy becomes internally inconsistent, eventually some entrepreneurs must abandon their projects because there are insufficient capital goods to carry them all to completion. This appears to us as a “recession,” in which many firms lay off workers and scale back their operations, if not close shop altogether. Although painful, the recession period is necessary for workers and other resources to get reallocated to more sustainable niches of the economy. (In what has come to be known as my “sushi article,” I give a fable explaining all of this, and in my longer follow-up response to Paul Krugman, I spell out Austrian capital theory and business cycle theory more methodically.)
In a recent post on his personal blog, Scott Sumner (one of the leaders of the Market Monetarists) criticized the Austrian perspective, as least as it pertains to the housing boom and bust. (In this post, I showed that it made sense to apply ABCT to the housing bubble.) Here’s Sumner:
When I first started blogging, a number of Austrian commenters told me the real problem was not tight money. Rather there had been “malinvestment” in housing, especially in the “sand states”. The recession was the price we had to pay for all of this poorly thought out investment.
That theory never even made sense in 2009. If the problem was malinvestment in housing, then resources would have shifted to the other 95% of the economy. Instead, output fell in almost all sectors. (I’m referring to 2008–09; resources did shift to other sectors during the 2006–07 construction slump.)
Today it makes even less sense. The NYT has an article on the housing market in North Las Vegas, which was the epicenter of the bust. It’s now booming...
Sumner then quotes from the NYT piece, explaining how the Vegas market now one of the fastest-growing in the country. Sumner goes on to write:
I agreed that there had been some excessive housing construction in the inland portion of the sand states. ... But I argued that these cities were fast growing, and this problem was relatively mild. In my view the malinvestment is better termed “too early investment”—some houses were built a few years before they were needed. The Austrian counterargument was that these houses would remain empty for decades, and eventually depreciate sharply (in a physical sense.) It looks like I was closer to the truth. [Scott Sumner, bold added.]
Now, in the comments of Sumner’s post, you’ll see that I asked for an example of an Austrian making such a claim about the housing market. At face value, that seemed to be a silly thing to say; after all, the owner of an empty house, no matter how much he paid to build it, would eventually admit defeat and either sell at a loss or start renting it out to tenants. Sunk costs are sunk, as Austrians and other economists know. (You can see for yourself at the link that Sumner did not rise to my challenge, though in fairness perhaps he misunderstood what a fan of Hayek had been arguing years ago in his comments.)
But focus now on the part I’ve put in bold in the block quotation from Sumner. He seems to think this is a radical departure from the Austrian perspective, when in fact it’s not at all. Indeed, that’s what many Austrians would have said they meant by “malinvestment.” A related feature would be that many houses were built that were too big.
In his grand treatise Human Action, Ludwig von Mises explained the difference between “malinvestment” and “overinvestment” using—believe it or not—a metaphor of a house project. Here’s Mises, describing the situation during an unsustainable boom when artificially cheap credit has misled people:
The whole entrepreneurial class is, as it were, in the position of a master-builder whose task it is to erect a building out of a limited supply of building materials. If this man overestimates the quantity of the available supply, he drafts a plan for the execution of which the means at his disposal are not sufficient. He oversizes the groundwork and the foundations and only discovers later in the progress of the construction that he lacks the material needed for the completion of the structure. It is obvious that our master-builder’s fault was not overinvestment, but an inappropriate employment of the means at his disposal. [Mises, Human Action, Scholar’s Edition, p. 594.]
So contrary to Sumner’s perspective, when the Austrians speak of “malinvestments” during the housing boom years in the mid-2000s, they weren’t predicting that Las Vegas would be a ghost town for the next 30 years. Rather, they simply meant that too many houses were being built ahead of schedule, and further that many of these houses were bigger than they should have been.
For an analogy, Austrians would also say the moonshot under President Kennedy was a gross waste of resources. Yet someday, private companies will no doubt be profitably sending passengers and cargo from Earth to the moon. The fact that the moonshot was merely “too early” in the 1960s doesn’t change the fact that it was a bad investment—a misuse of scarce resources—at that time.
By the same token, the fact that the Las Vegas real estate market has rebounded after a huge crash—especially in the midst of rock-bottom interest rates—is hardly embarrassing for the Austrian worldview:

To repeat, Austrians like me have been jumping up and down since 2008, warning people that Bernanke was blowing up giant asset bubbles just like Greenspan had done after the dot-com crash. So how in the world is the above chart supposed to show that the Austrians have been wrong? If we were right, isn’t the above chart exactly what things would look like?
More On the Reallocation Story
Now that I’ve clarified what Austrians mean by “malinvestment,” let’s circle back to Sumner’s claim that the Austrian story never even made sense early on. To remind the reader, here’s what Sumner said on this score:
When I first started blogging, a number of Austrian commenters told me the real problem was not tight money. Rather there had been “malinvestment” in housing, especially in the “sand states”. The recession was the price we had to pay for all of this poorly thought out investment.
That theory never even made sense in 2009. If the problem was malinvestment in housing, then resources would have shifted to the other 95% of the economy. Instead, output fell in almost all sectors. (I’m referring to 2008-09; resources did shift to other sectors during the 2006-07 construction slump.)
In the parenthetical sentence at the end of the quotation above, I believe Sumner is repeating a factual mistake that he made years ago. So I’ll repeat the correction I offered him at the time:
Sumner thinks there was a “construction slump” from 2006-07, and yet “resources did shift to other sectors,” because in January 2006, housing starts were 2.3 million while unemployment was 4.7%. But by April 2008, housing starts had plummeted to 1.0 million, yet unemployment was only 4.9%. This is why, to repeat, Sumner thinks the Austrian “reallocation story” makes no sense. In Sumner’s view, apparently the economy was able to jettison a huge portion of workers out of construction into other sectors, so long as the Fed kept nominal GDP chugging along, but once the Fed inexplicably tightened monetary policy, that’s when unemployment spiked.
Yet as I explained at the time, there’s a huge flaw in Sumner’s argument. It’s true that housing starts collapsed from January 2006 to April 2008, but that’s not true of construction employment, which fell from 7.6 million to 7.3 million. Even though housing starts fell by 57%, construction employment during that period only fell by 4%.
The following chart plots total construction employment (blue, left axis) against the national unemployment rate (red, right axis). Doesn’t this look exactly like the Austrian story?

Regarding the above chart, I’m not merely referring to the tail end when the crash happened. Even going into the crazy bubble years, the above chart fits the Austrian story beautifully: As construction employment surged (blue line), rising from 6.7 million in early 2003 to 7.8 million by early 2006, the national unemployment rate (red line) fell from 6% to almost 4.5%. And then, when construction employment really did start plummeting—which happened well after the point that Sumner would have you believe—that’s precisely when the national unemployment rate starts rising rapidly. What would the chart need to look like, to vindicate the Austrians?
Let’s also remember a point that came up in one of my battles with Krugman. Krugman (like Sumner) had tried to pooh-pooh the “real resource reallocation” story of the housing boom/bust by pointing out that as of the end of 2008, year/year increases in state unemployment rates didn’t seem to match up with those states that had had the biggest housing price collapses.
But as I pointed out in my response, the housing bust (as measured by prices) had been well underway at the start of 2008, and so it was odd to use that as the start date. If instead we looked at the states from the peak of the housing price bubble, i.e., June 2006, through December 2008, then we found the following: Of the six states with the biggest drop in housing prices during this period, five of them were also on the list of the six states with the biggest jump in their unemployment rates during this same period. So that seems hard to reconcile with a theory that blames the recession on a drop in Aggregate Demand (Krugman’s story) or “passive tightening by the Fed” (Sumner’s story).
Finally, regarding Sumner’s question of why we saw a general downturn rather than a rapid and smooth sectoral readjustment after 2007: I explained this in great detail in my “sushi article.” But for this article I’ll be brief: During the boom period, entrepreneurs are misled by artificially low interest rates and make offers to workers that are too generous. So workers eagerly quit their old jobs and take the new, better ones. (And, some of those who were previously unemployed take the lucrative job offers.)
Yet after the bust, most people realize that they are poorer than they had thought. Workers get laid off from their desired jobs, and now have to decide which of less attractive options they are going to pick. There is uncertainty of course, as employers and unemployed workers engage in a giant process of search and matching. It’s not mysterious at all that during such an upheaval—and especially when the Fed and Bush/Obama administrations are wasting hundreds of billions while violating contractual arrangements—even people who kept their jobs would reduce their discretionary spending, and sectors all throughout the economy would scale back operations.
Mercatus Study: What Housing Bubble?
And so we’ve seen that Scott Sumner’s pushback against the Austrian view doesn’t really make sense. However, at least Sumner had the decency to admit that there had been too much (or at least too early) housing.
Yet Sumner’s colleague Kevin Erdmann, in a study for the Mercatus Center, takes the counter-narrative a step further. Far from too many resources going into housing during the bubble years, Erdmann argues that the US suffered from a housing shortage during these years! As Erdmann asks (and answers) in the opening of his study: “How bad was the supply overhang [after 2008]? Surprisingly, the answer may be that there never was one.”
The reader can hopefully see why Erdmann’s thesis poses such a problem for not just the Austrians, but for most other analysts who have thought there was an artificial boom in housing from (say) 2002–2006.
For example, here is one of Erdmann’s key graphs:

Source: Kevin Erdmann, figure 1.
On the face of it, Erdmann is trying to demonstrate that if we use an objective measure, then it seems there was nothing unusual—from a historical perspective—about the growth in the stock of housing in the mid-2000s. After all, even at its recent peak, the particular measure of “Housing Units per capita” was still lower than it had been in the late 1980s.
There are several responses I’ll give to this line of argument. First, who’s to say that the level in the late 1980s was correct? After all, there had been a devastating crash in the real estate market (and related crises in banking) following the “closing of loopholes” in the 1986 Tax Reform Act.
A second problem is that there is an admitted discontinuity in the data set, which is why Erdmann draws the dotted line in his graph. If we just start with the consistent data set beginning in 2000, then the chart is broadly consistent with the claim that there was an unsustainable surge in housing stock in the mid-2000s.
A third problem is that houses nowadays are much bigger than they were in the 1970s. Mark Perry reports that for new homes (of a certain category), living space per person has nearly doubled since 1973. A much more revealing statistic, then, would be something like, “Housing square footage per capita,” which I imagine would have been at all-time highs circa 2007 (though I couldn’t find the data needed to either back up or reject my hunch).
Finally and perhaps most serious, is the problem that Erdmann is playing central planner. We can’t look at aggregate statistics like “housing units per person” and decide whether “too much” or “too little” housing has been built in the country. If we could, then the socialist calculation problem would be a snap to solve.
Nobody denies that there was a tremendous surge in home prices up through 2006 or 2007 (depending on the index you use), followed by a large crash. How could such a volatile movement not have influenced actual investment decisions? Don’t Erdmann (and Sumner) think market prices guide entrepreneurs?
For example, check out the following aggregate statistic: the number of vacant housing units in the country:

As the chart indicates, from 2001 to the eve of the recession’s official start, the number of vacant housing units increased from 13.9 million to 18.6 million. That certainly seems like “overbuilding” beyond what “the fundamentals” would justify. Over the years, the number has fallen, but slowly. Isn’t this exactly what the “housing supply overhang” story would look like? Maybe there are some real-world on-the-ground facts about the housing market that Erdmann’s preferred statistics are failing to capture.
Finally, let me use an analogy to show the danger in Erdmann’s approach. You know it’s become part of conventional wisdom that there was an OPEC embargo and an “oil shortage” in the 1970s? Well, if you grab the actual data on crude oil consumption and divide by the US population, you realize that this typical narrative is totally wrong:
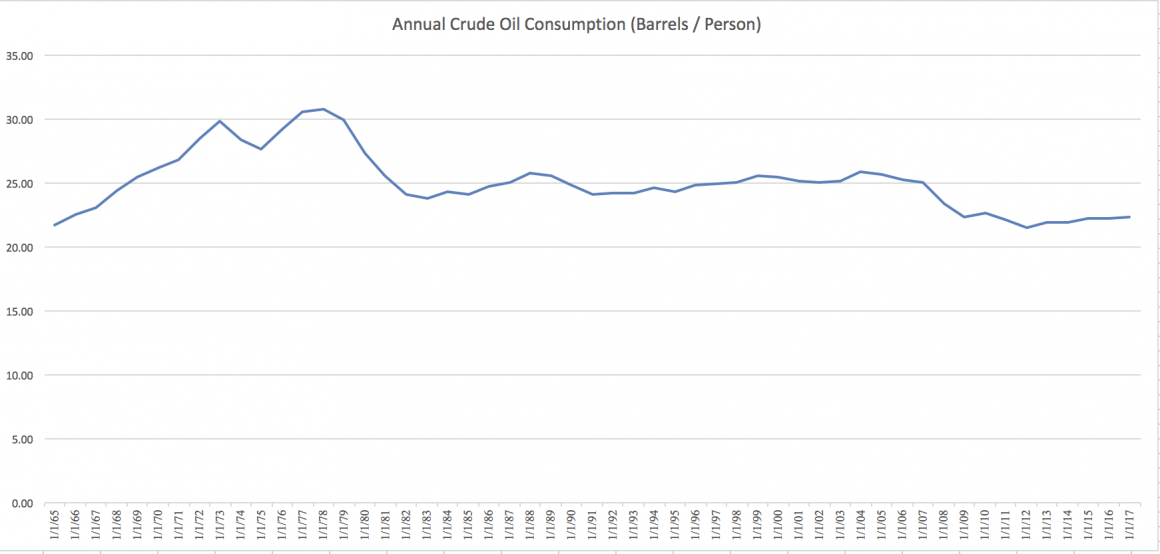
As it turns out, Americans consumed more barrels of crude per capita during the 1970s than at any time, before or since. The 1970s should go down in history as an energy glut.
Of course, I’m being facetious. Obviously, there were plenty of other changes in the oil industry over the last 50 years, so that you can’t simply look at a crude (no pun intended) statistic like “annual crude oil consumed per capita.” Among other problems, there were various layers of price controls on both gasoline and crude oil during the 1970s, which were responsible for the supply misallocations and the infamous lines at the pump.
My simple point is that if we wanted to talk about energy policy and discuss things such as supply bottlenecks and allocation problems, the above chart would be singularly unhelpful and in fact downright misleading. Yet that is analogous to what Erdmann is doing when he tries to argue that the alleged housing boom years were in fact marked by undersupply.
Conclusion
The Austrian perspective on the housing boom and bust lines up with common sense: Too many houses were built during the mid-2000s, and many of these houses were bigger than they should have been. The Austrians differ from most other analysts by blaming this outcome (largely) on loose Fed monetary policy.
Contrary to the claims of the Market Monetarists, the Austrian story fits the facts of the housing boom—and bust—much better than their preferred narrative.
Re-printed from Mises Wire with permission of the Mises Institute.